📑 Contents
1.
Wes' Devices WBR Cover Page
Sarah Chen
2.
Table of Contents
Sarah Chen
3.
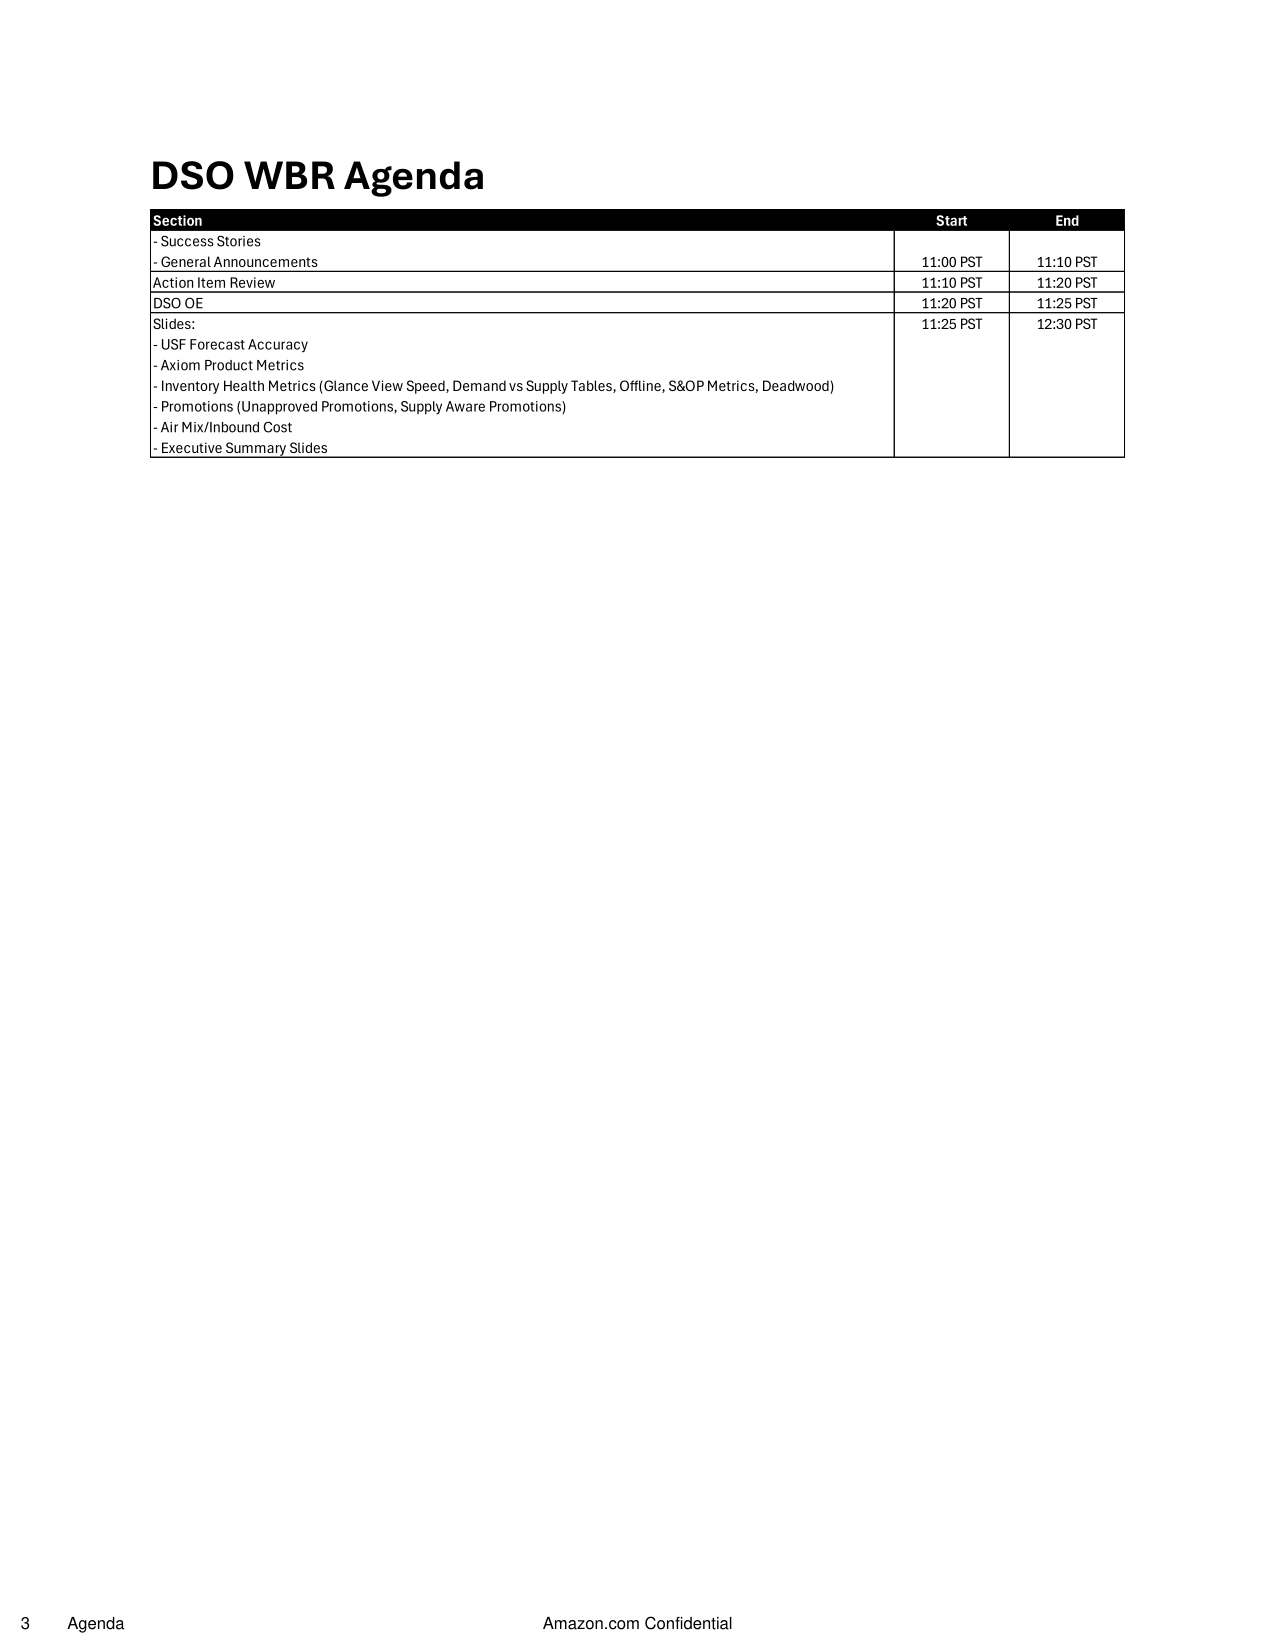
DSO WBR Agenda
Sarah Chen
4.
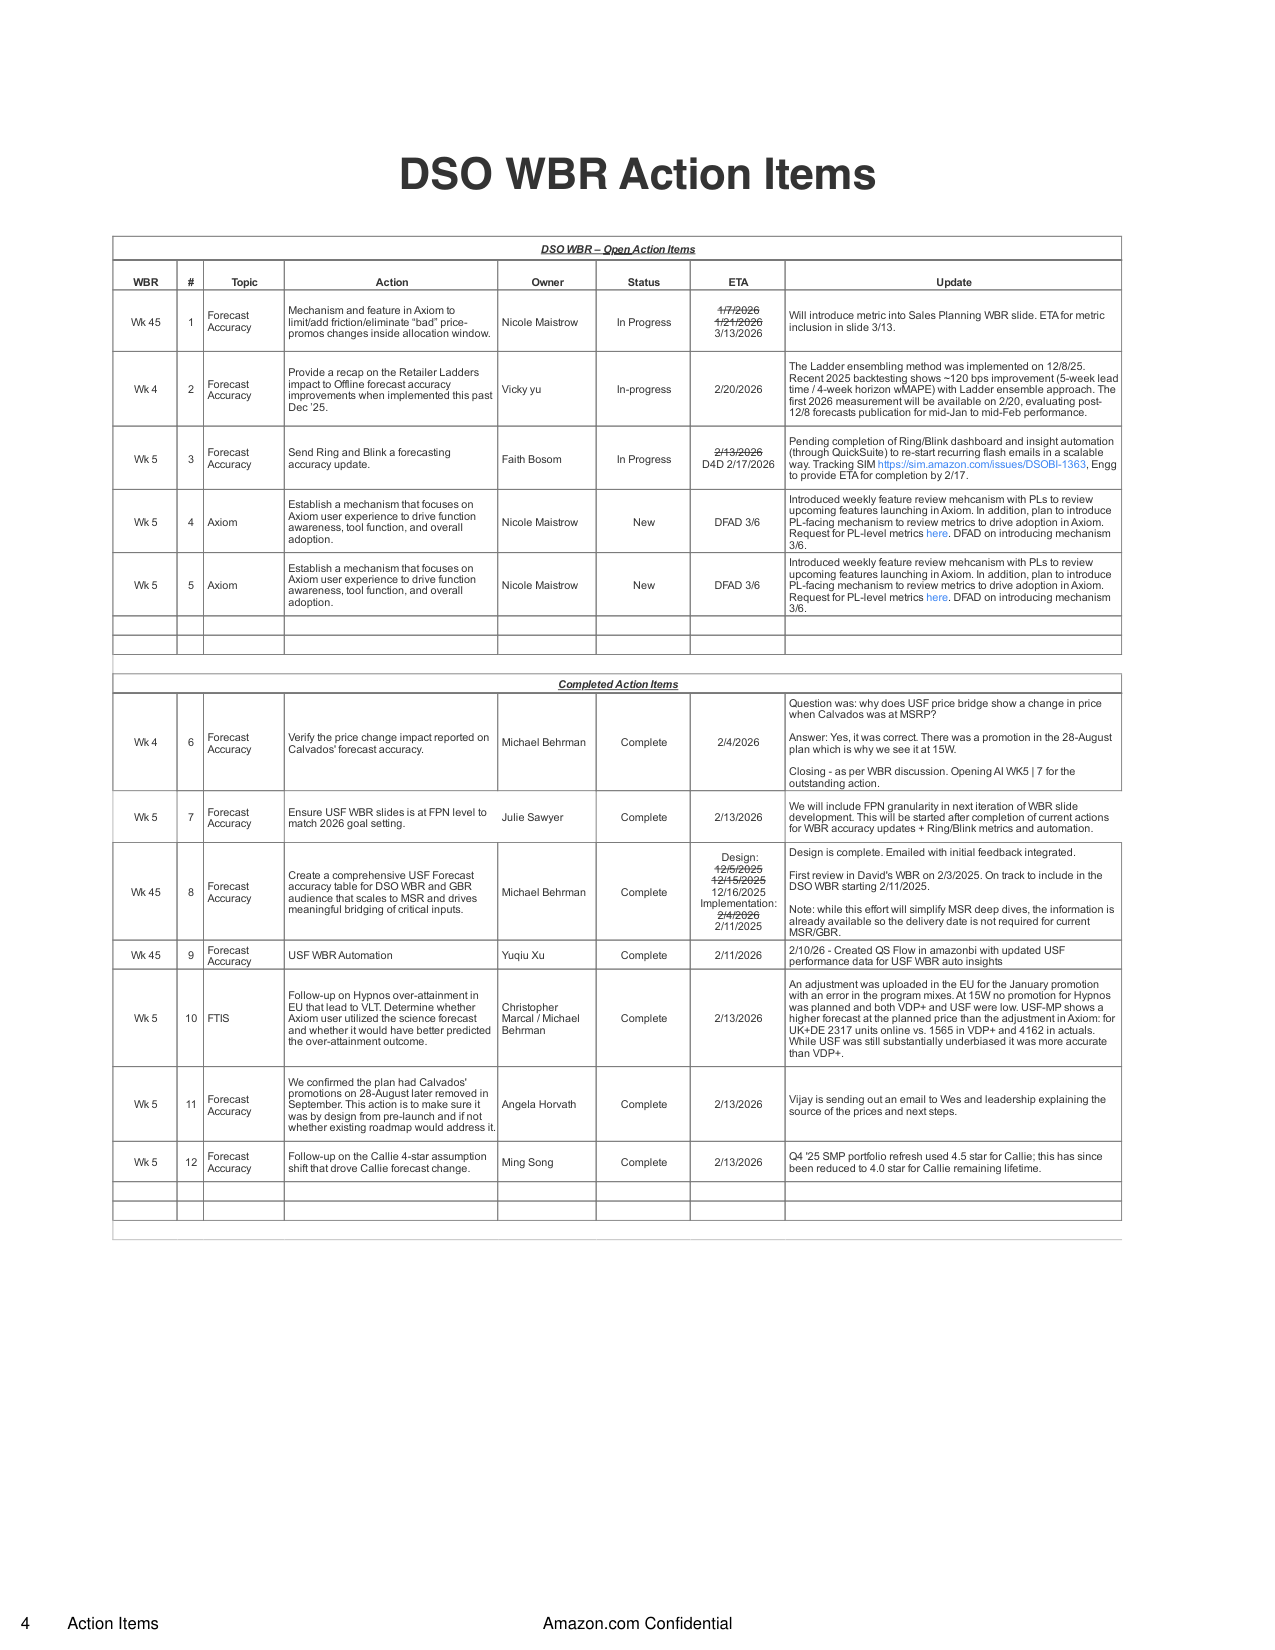
DSO WBR Action Items
Mike Johnson
5.
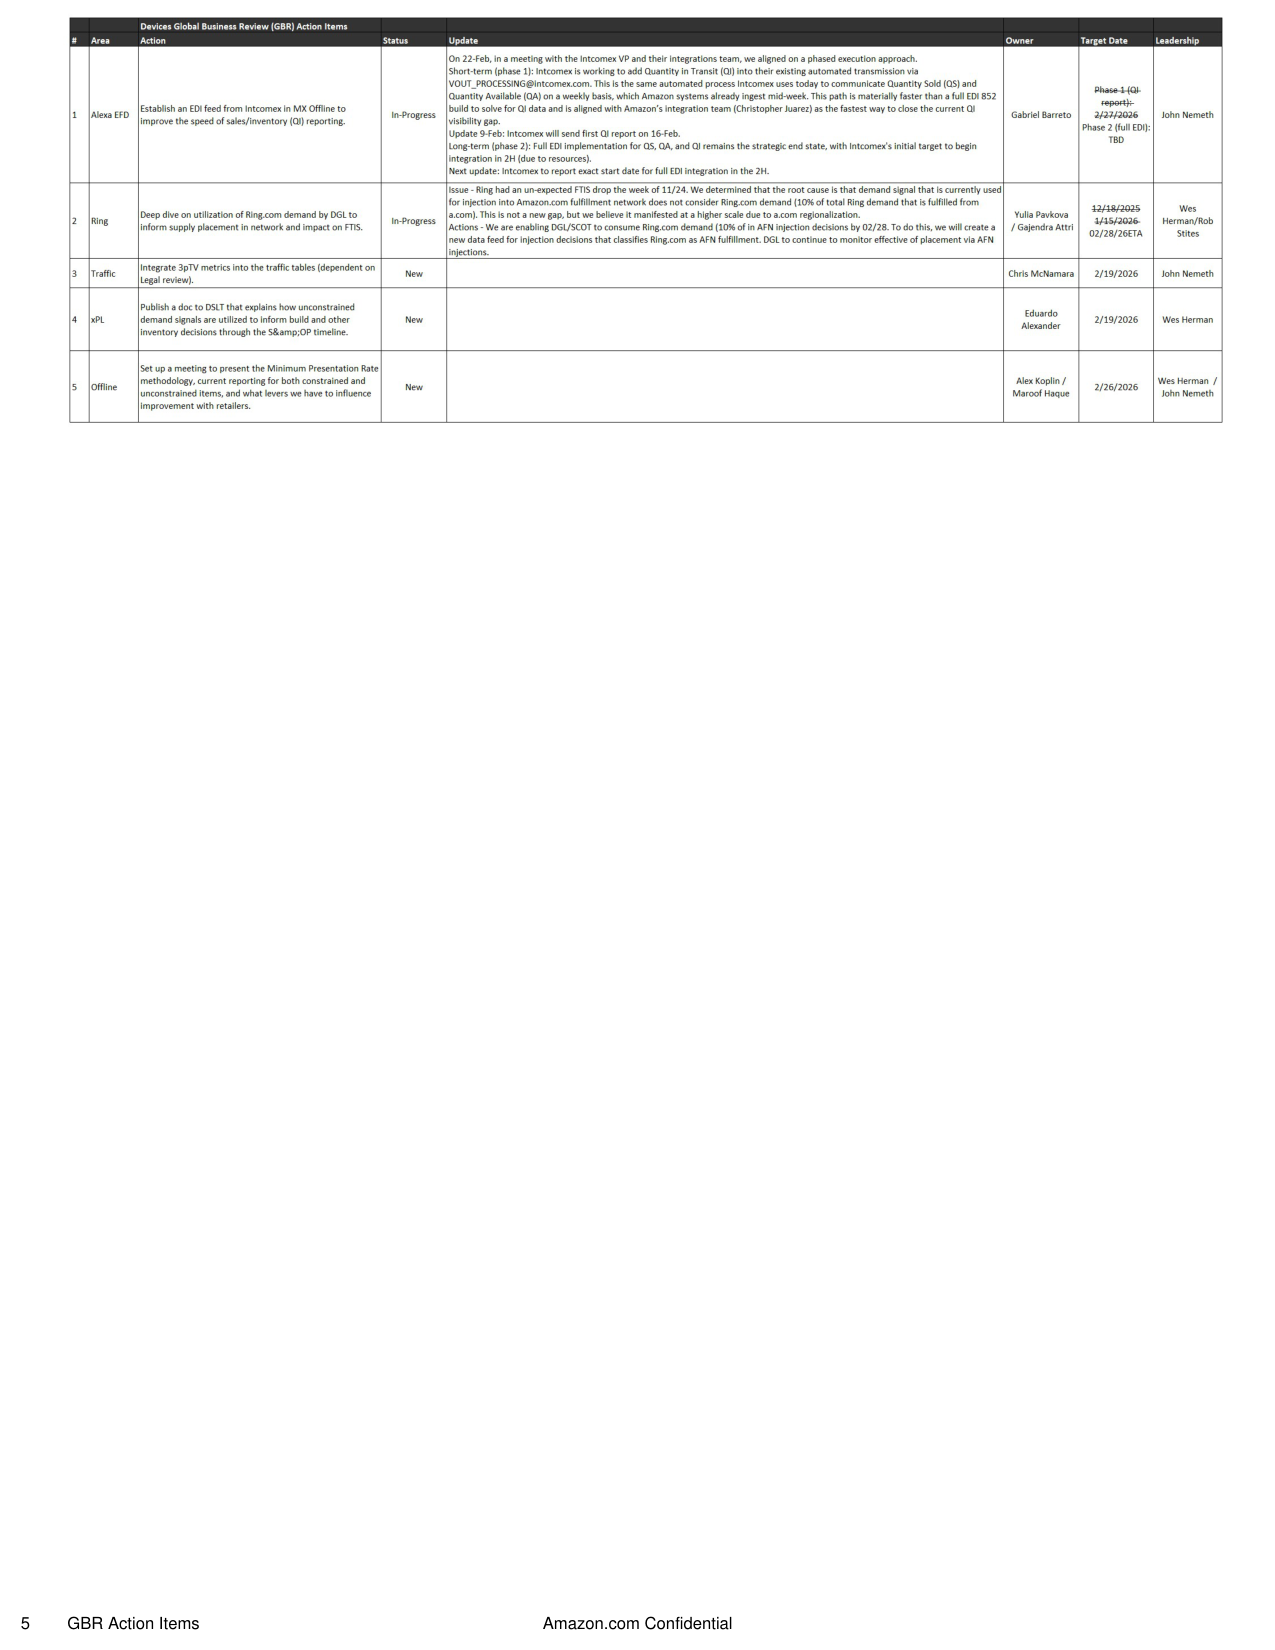
GBR Action Items
Mike Johnson
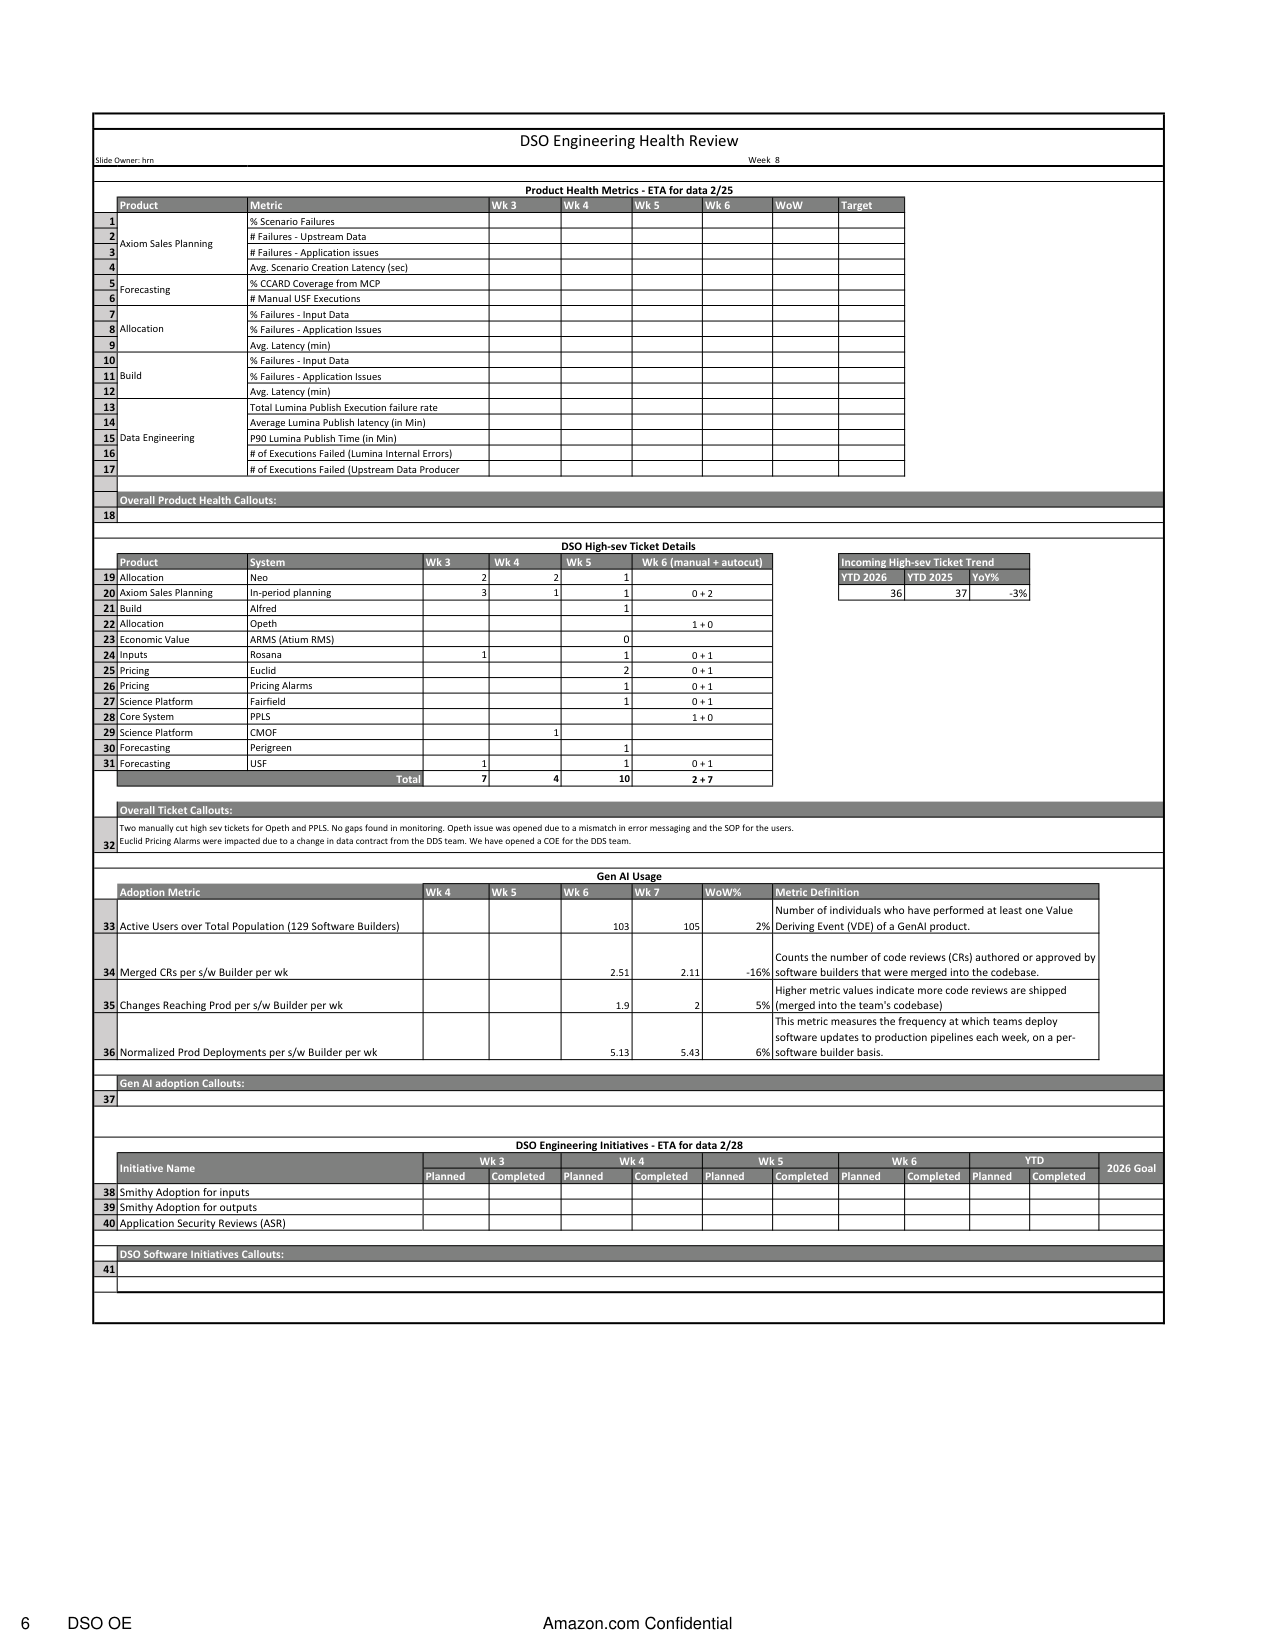
6.
DSO OE
Priya Patel
7.
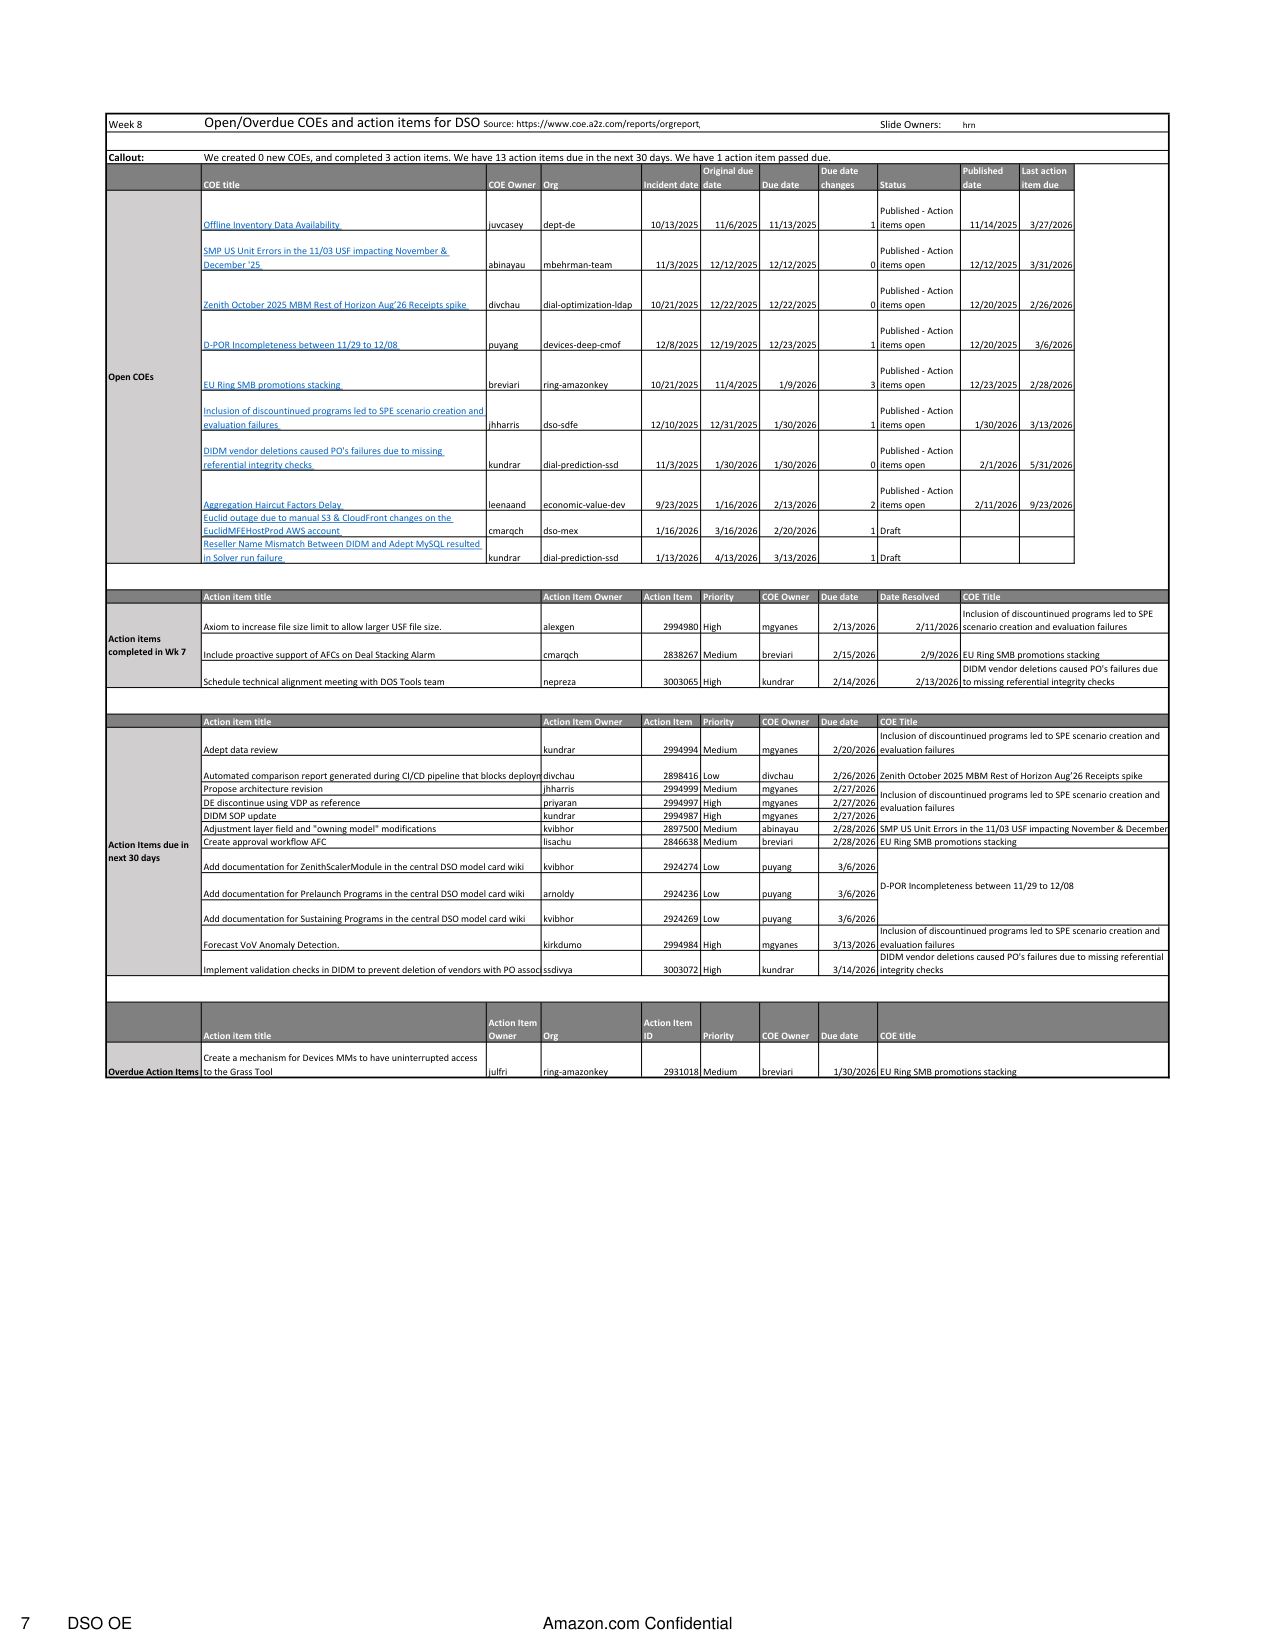
DSO OE - COEs and Action Items
Priya Patel
8.
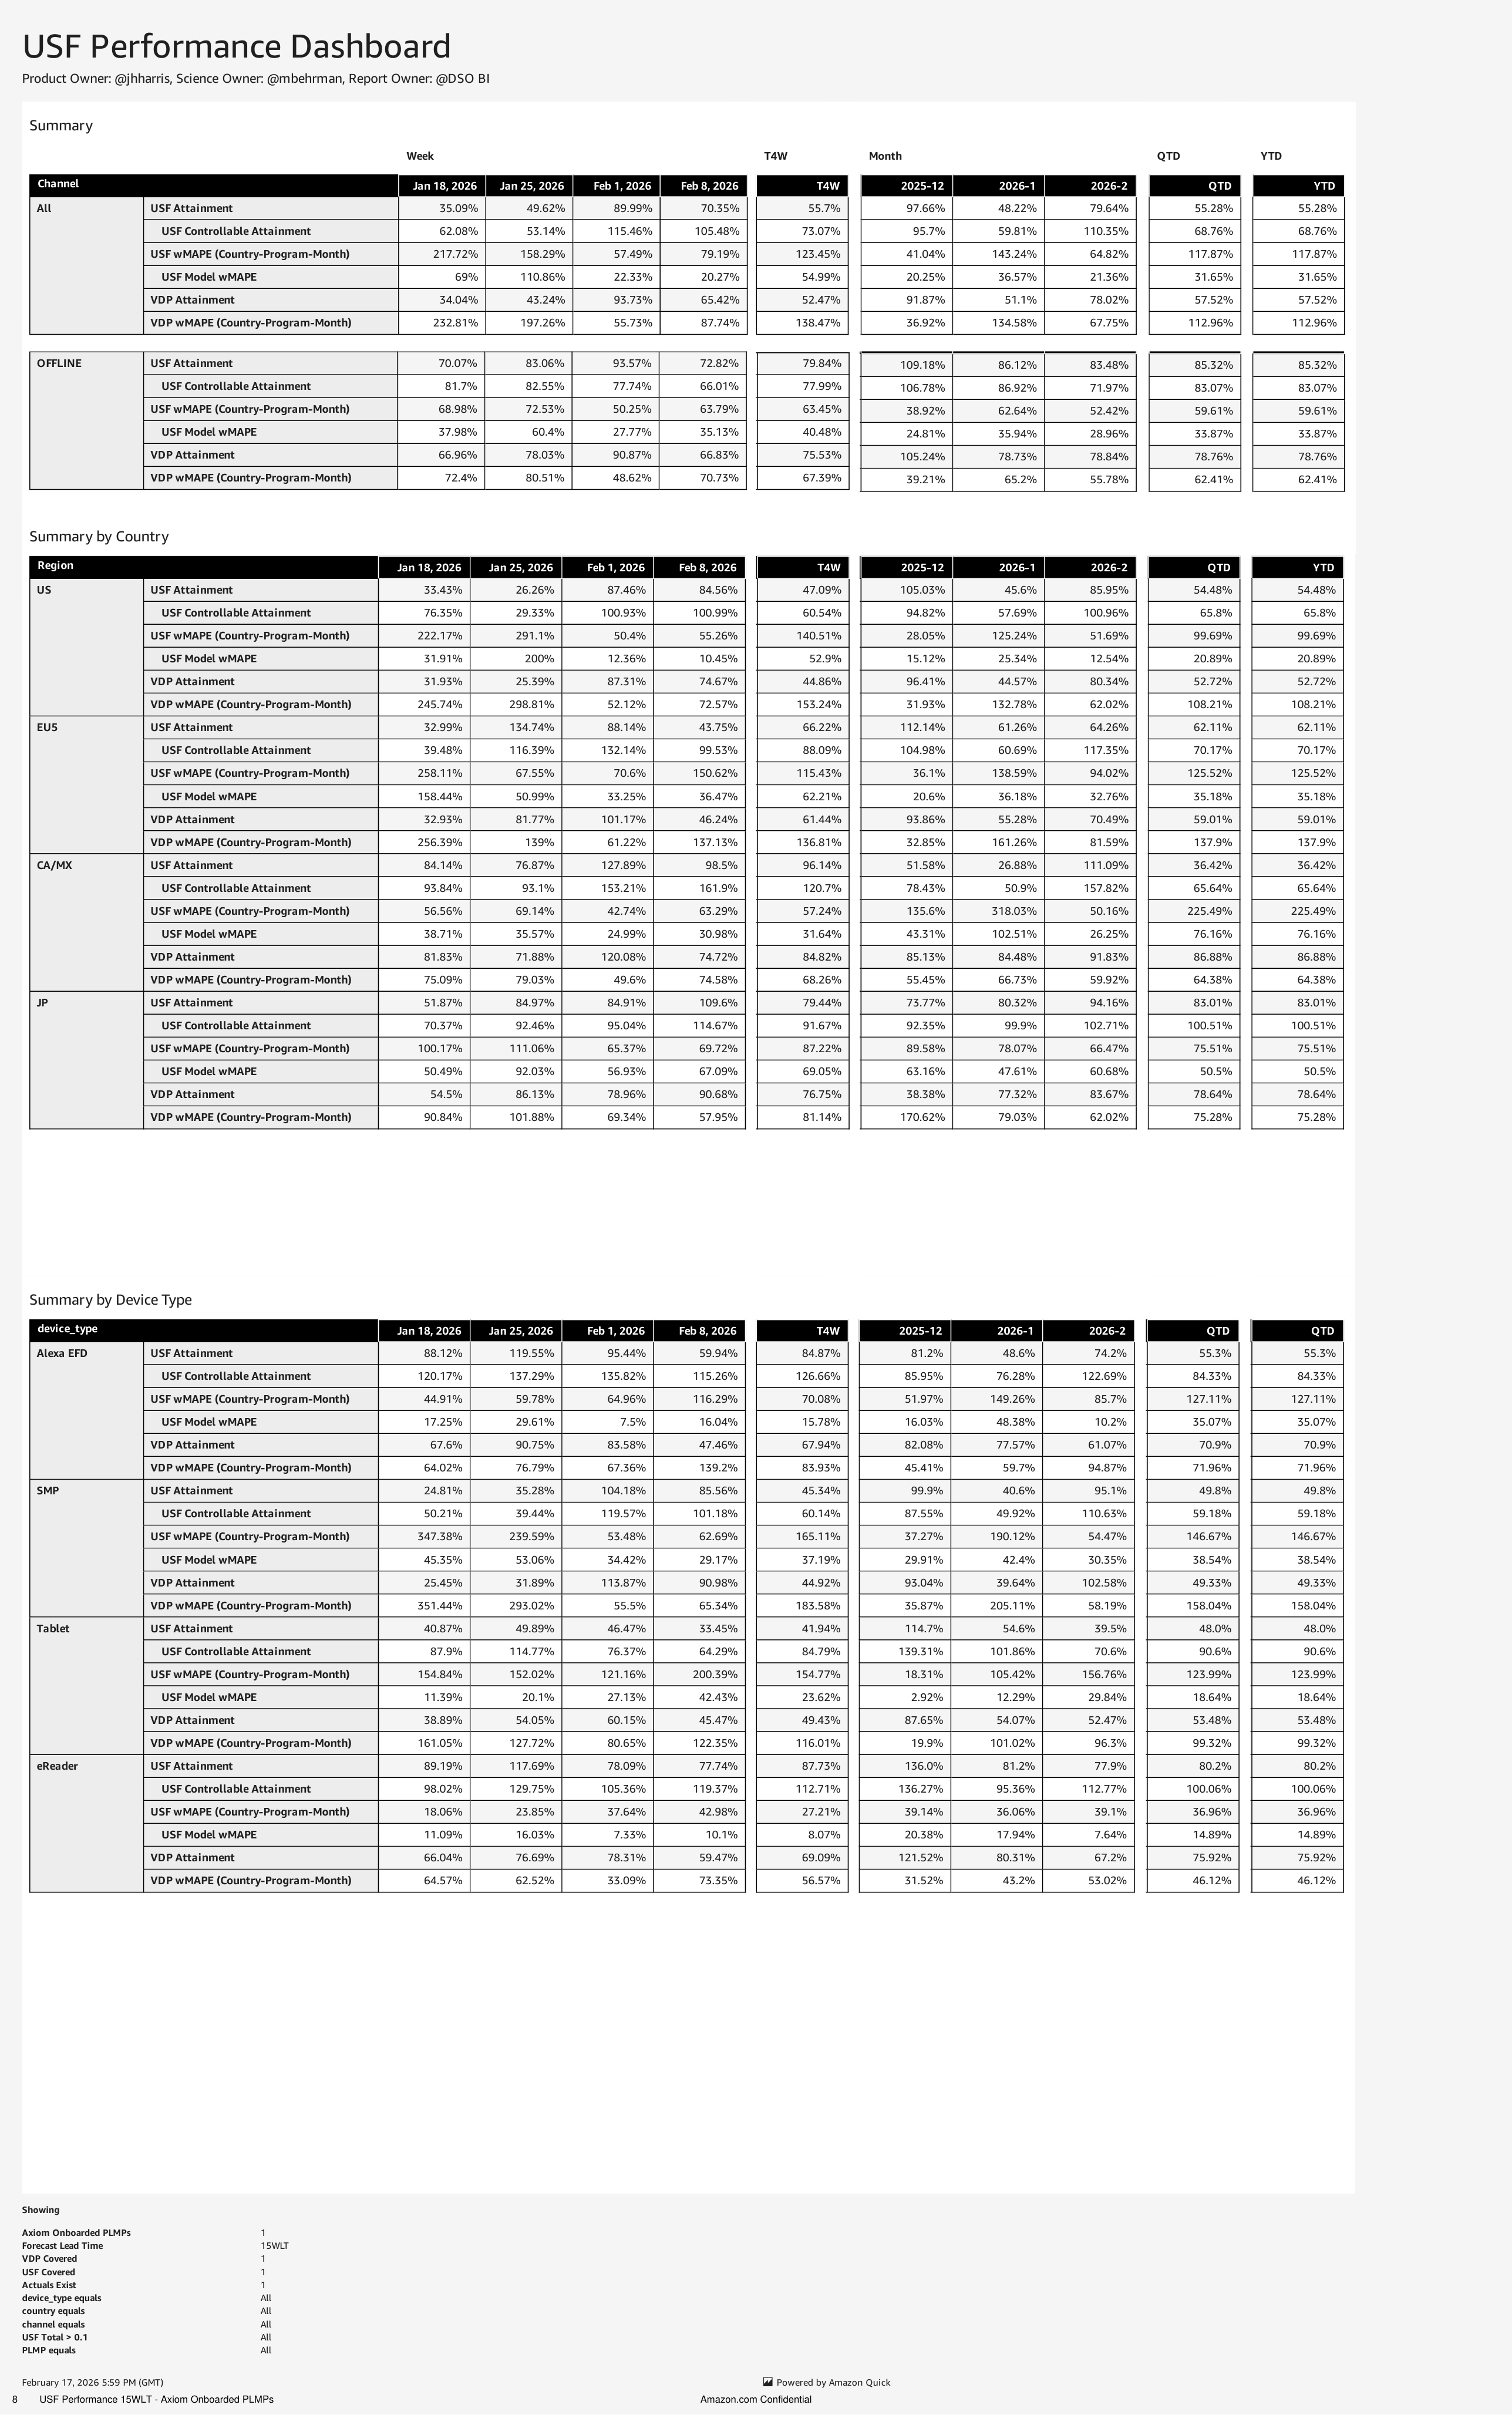
USF Performance 15WLT -...
Priya Patel
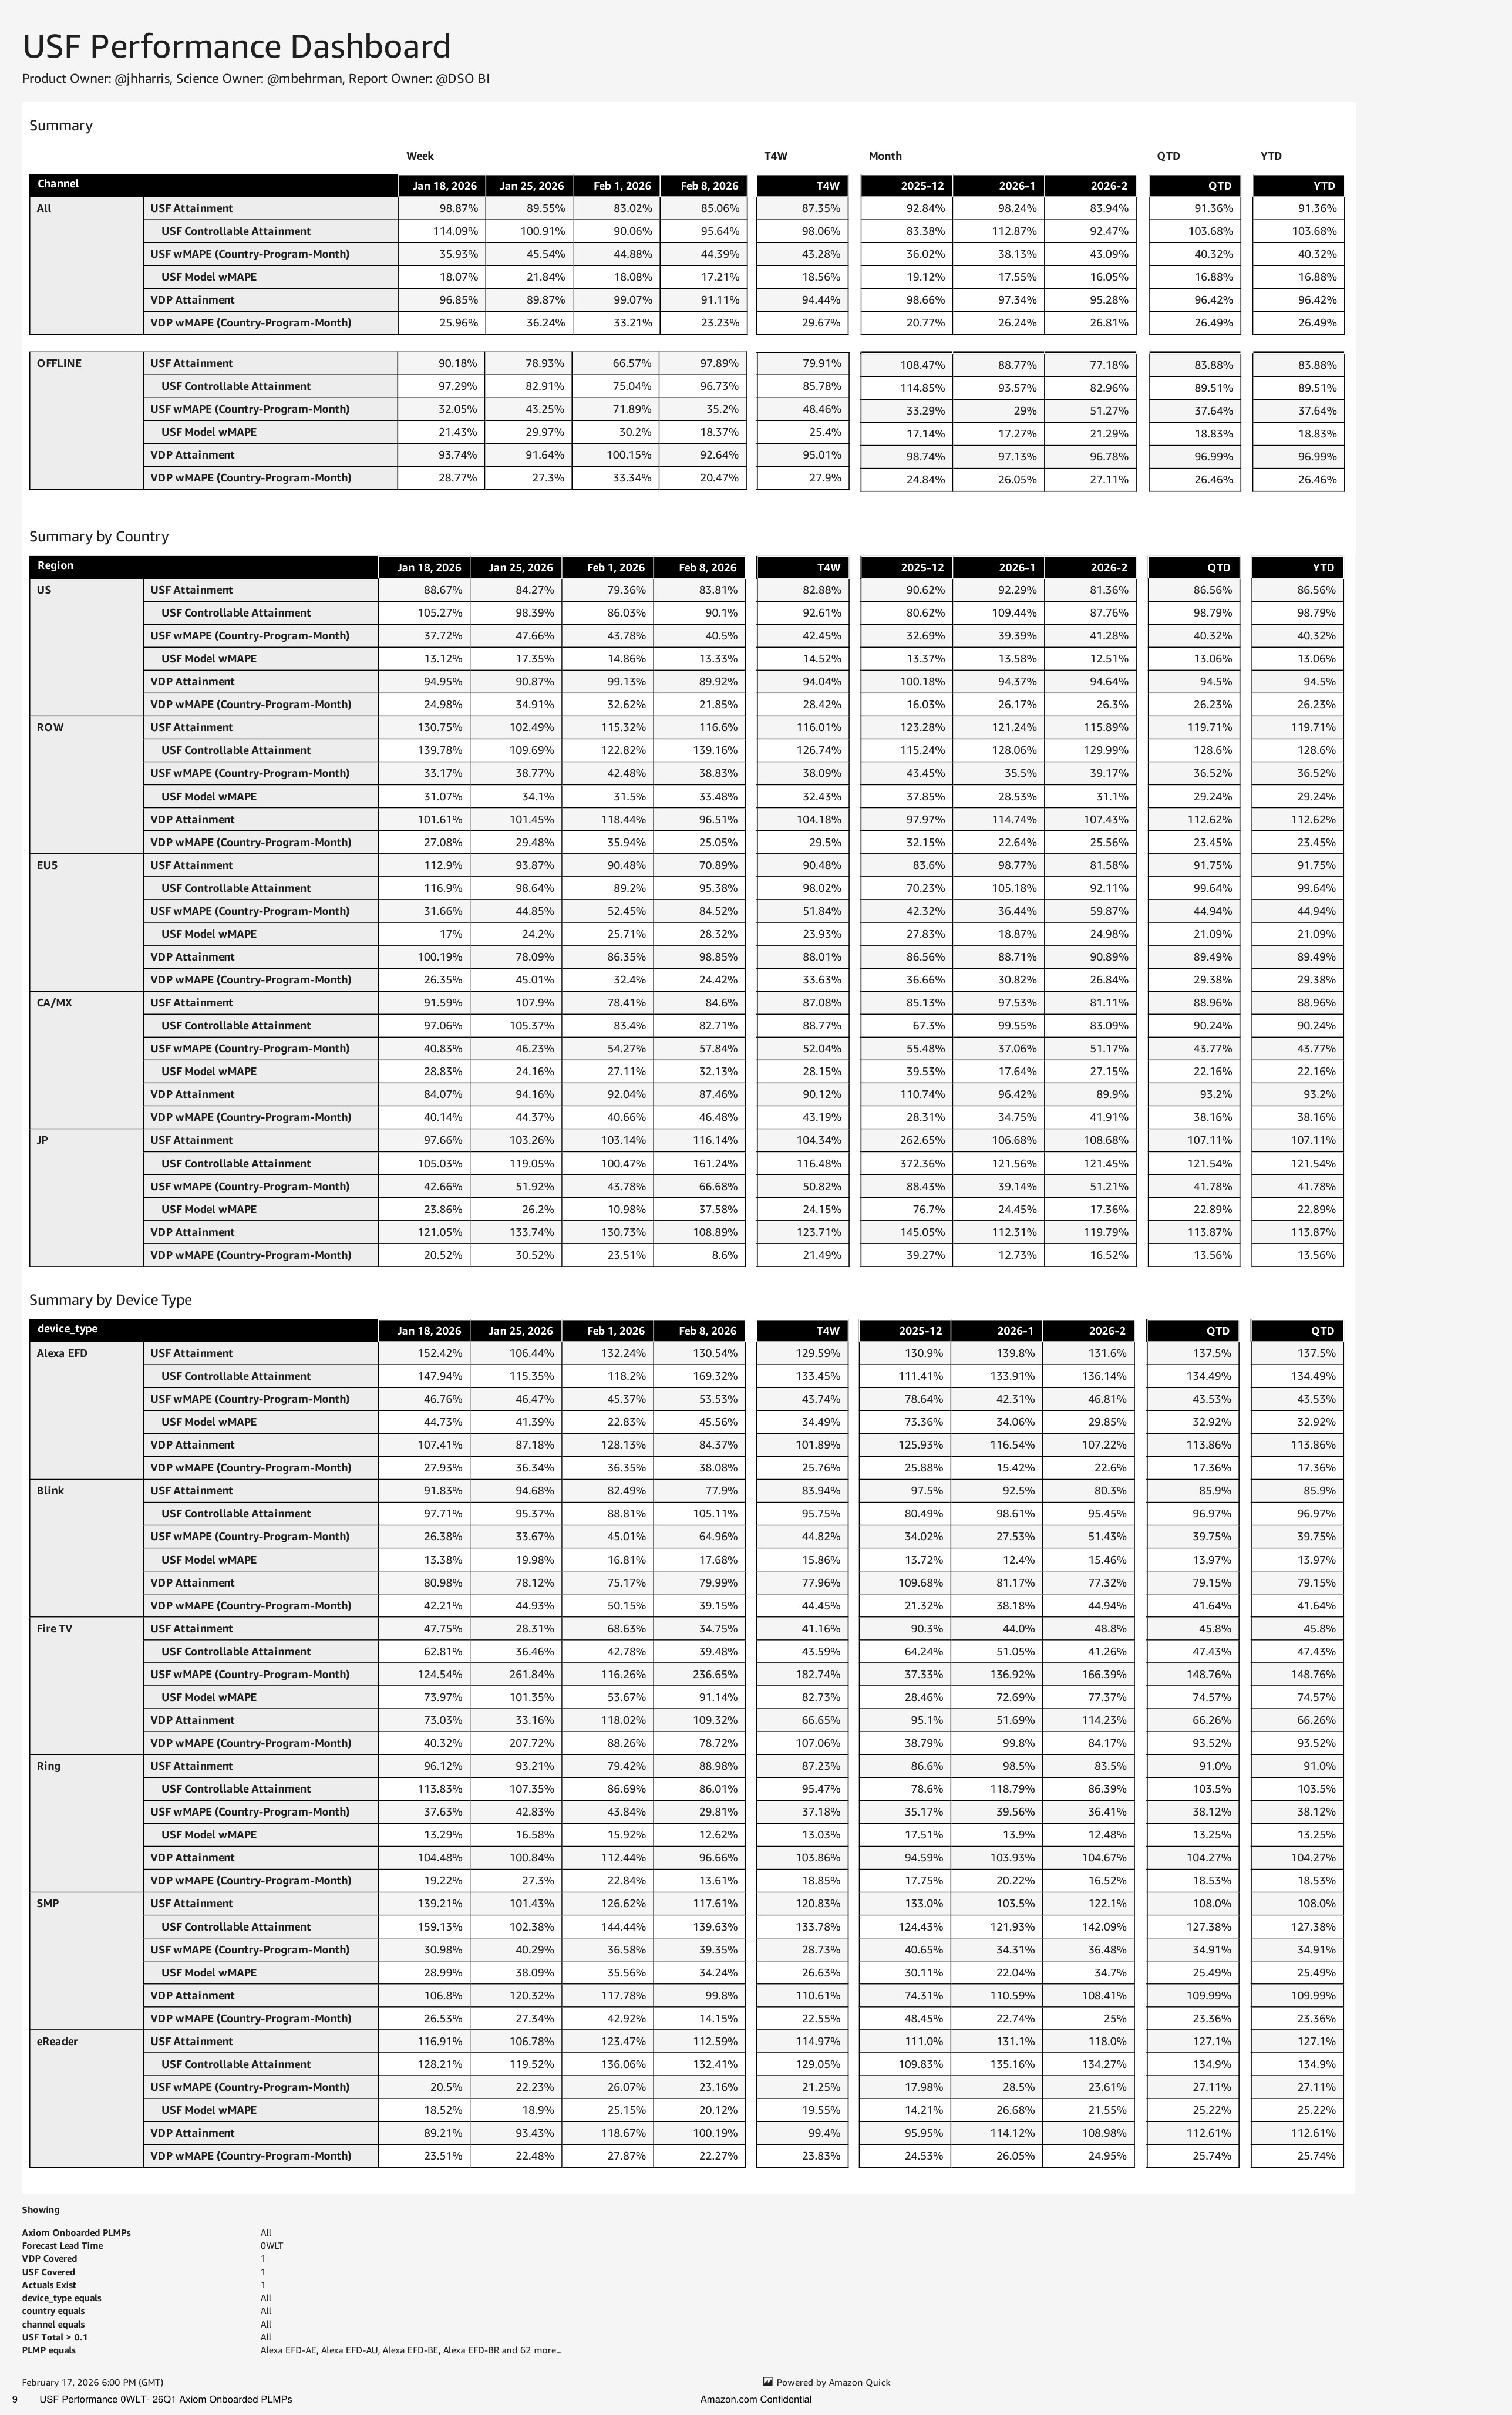
9.
USF Performance 0WLT- 26Q1...
James Wu
10.
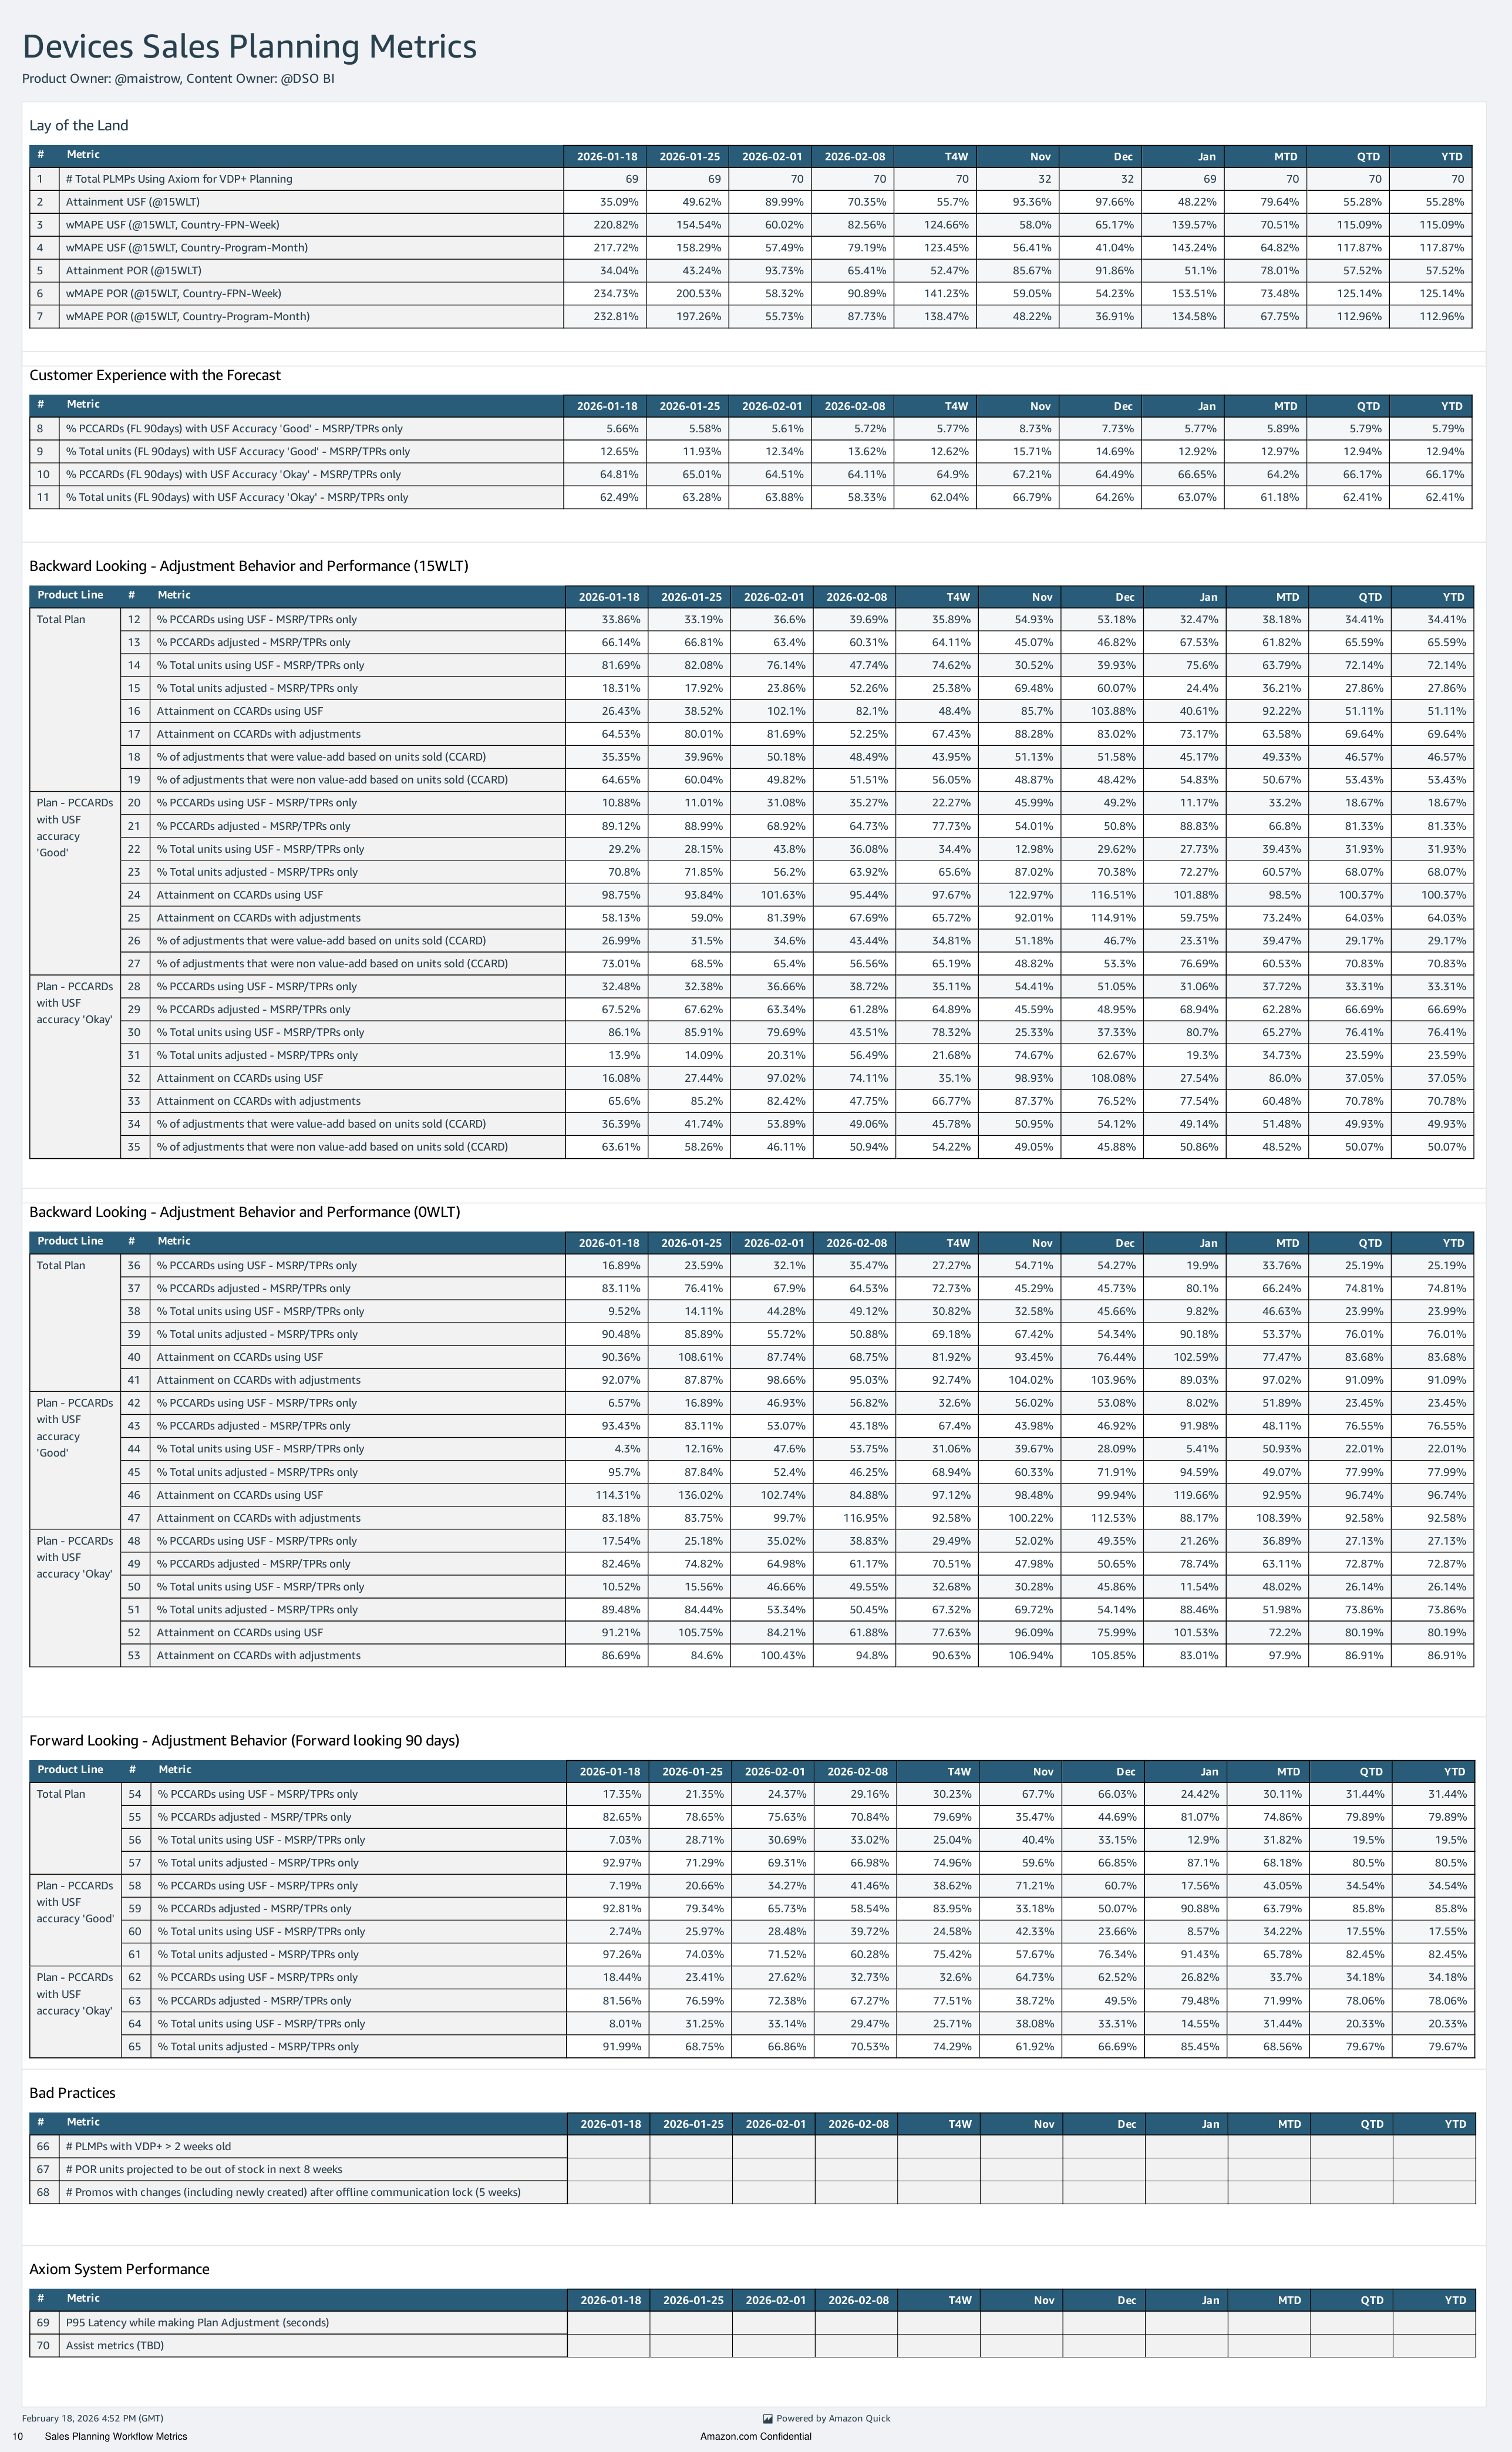
Sales Planning Workflow Metrics
James Wu
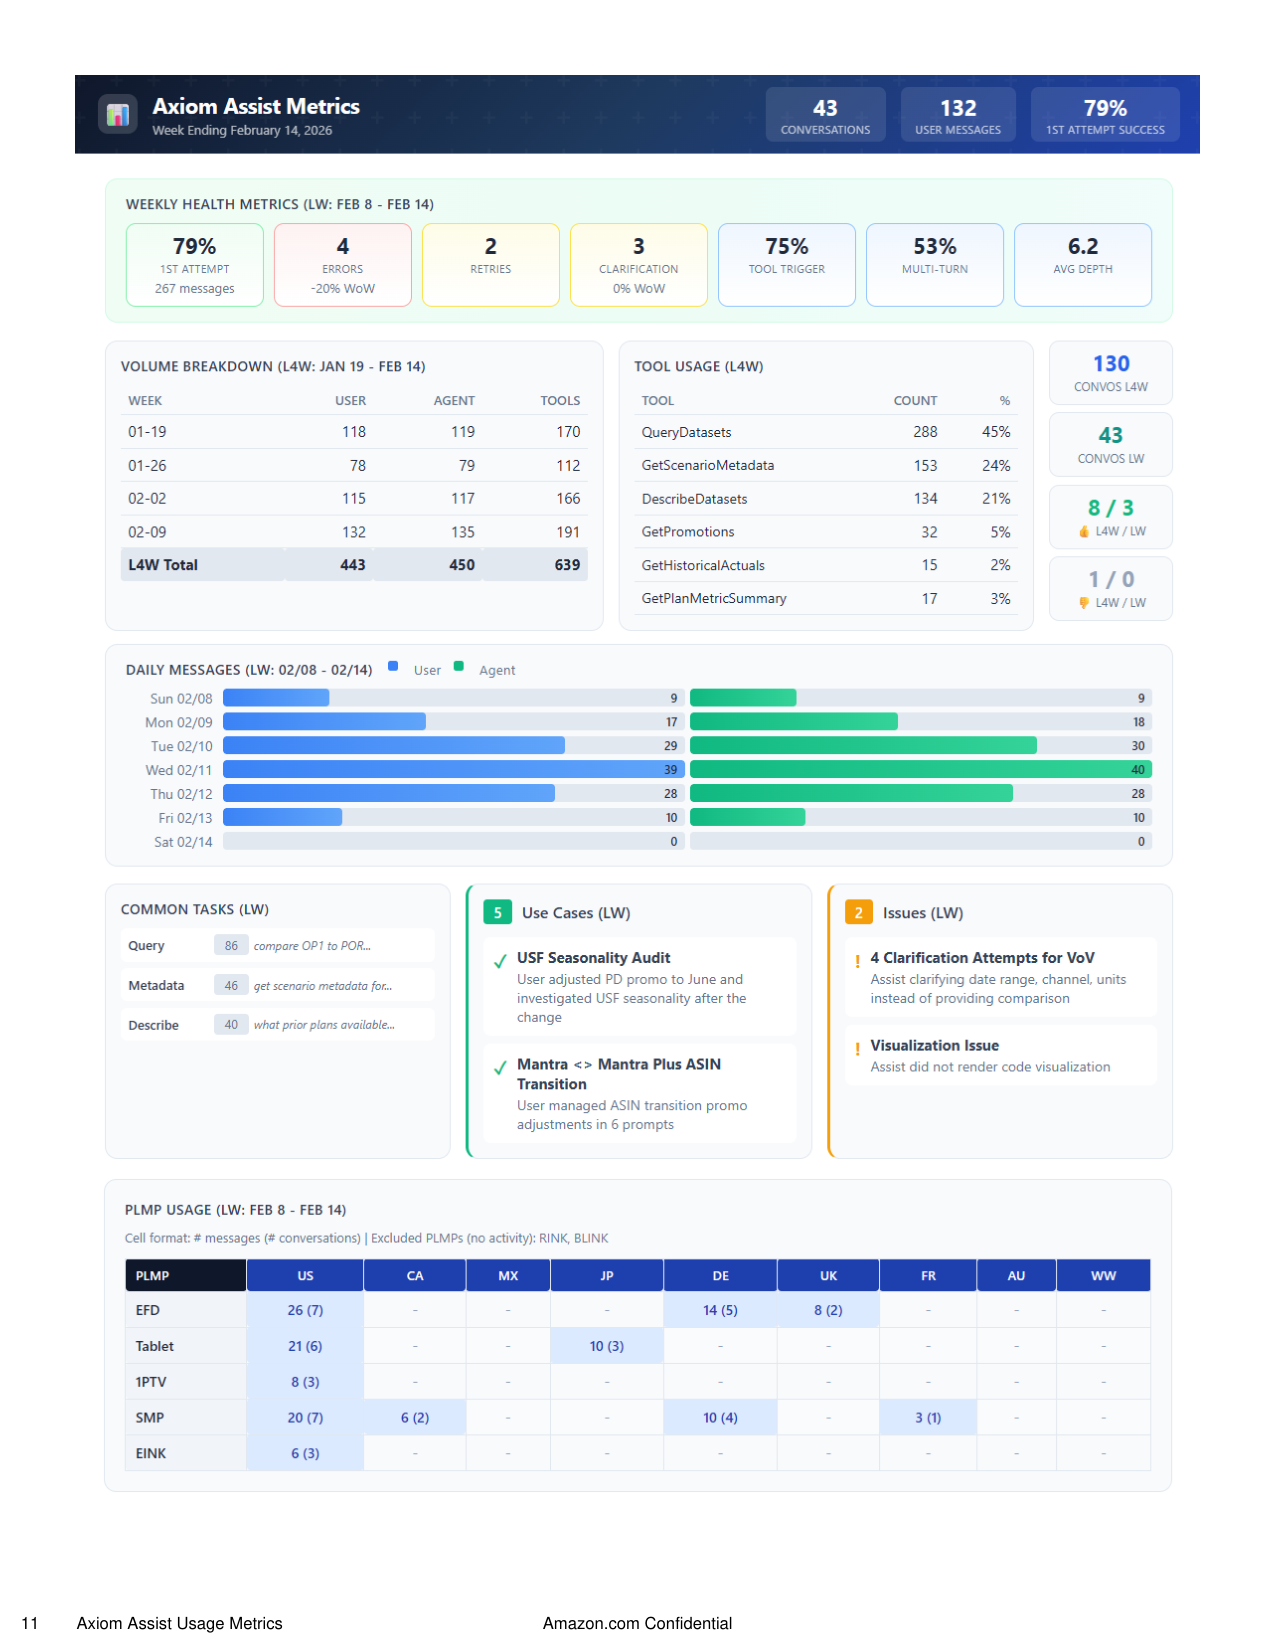
11.
Axiom Assist Usage Metrics
Lisa Martinez
12.
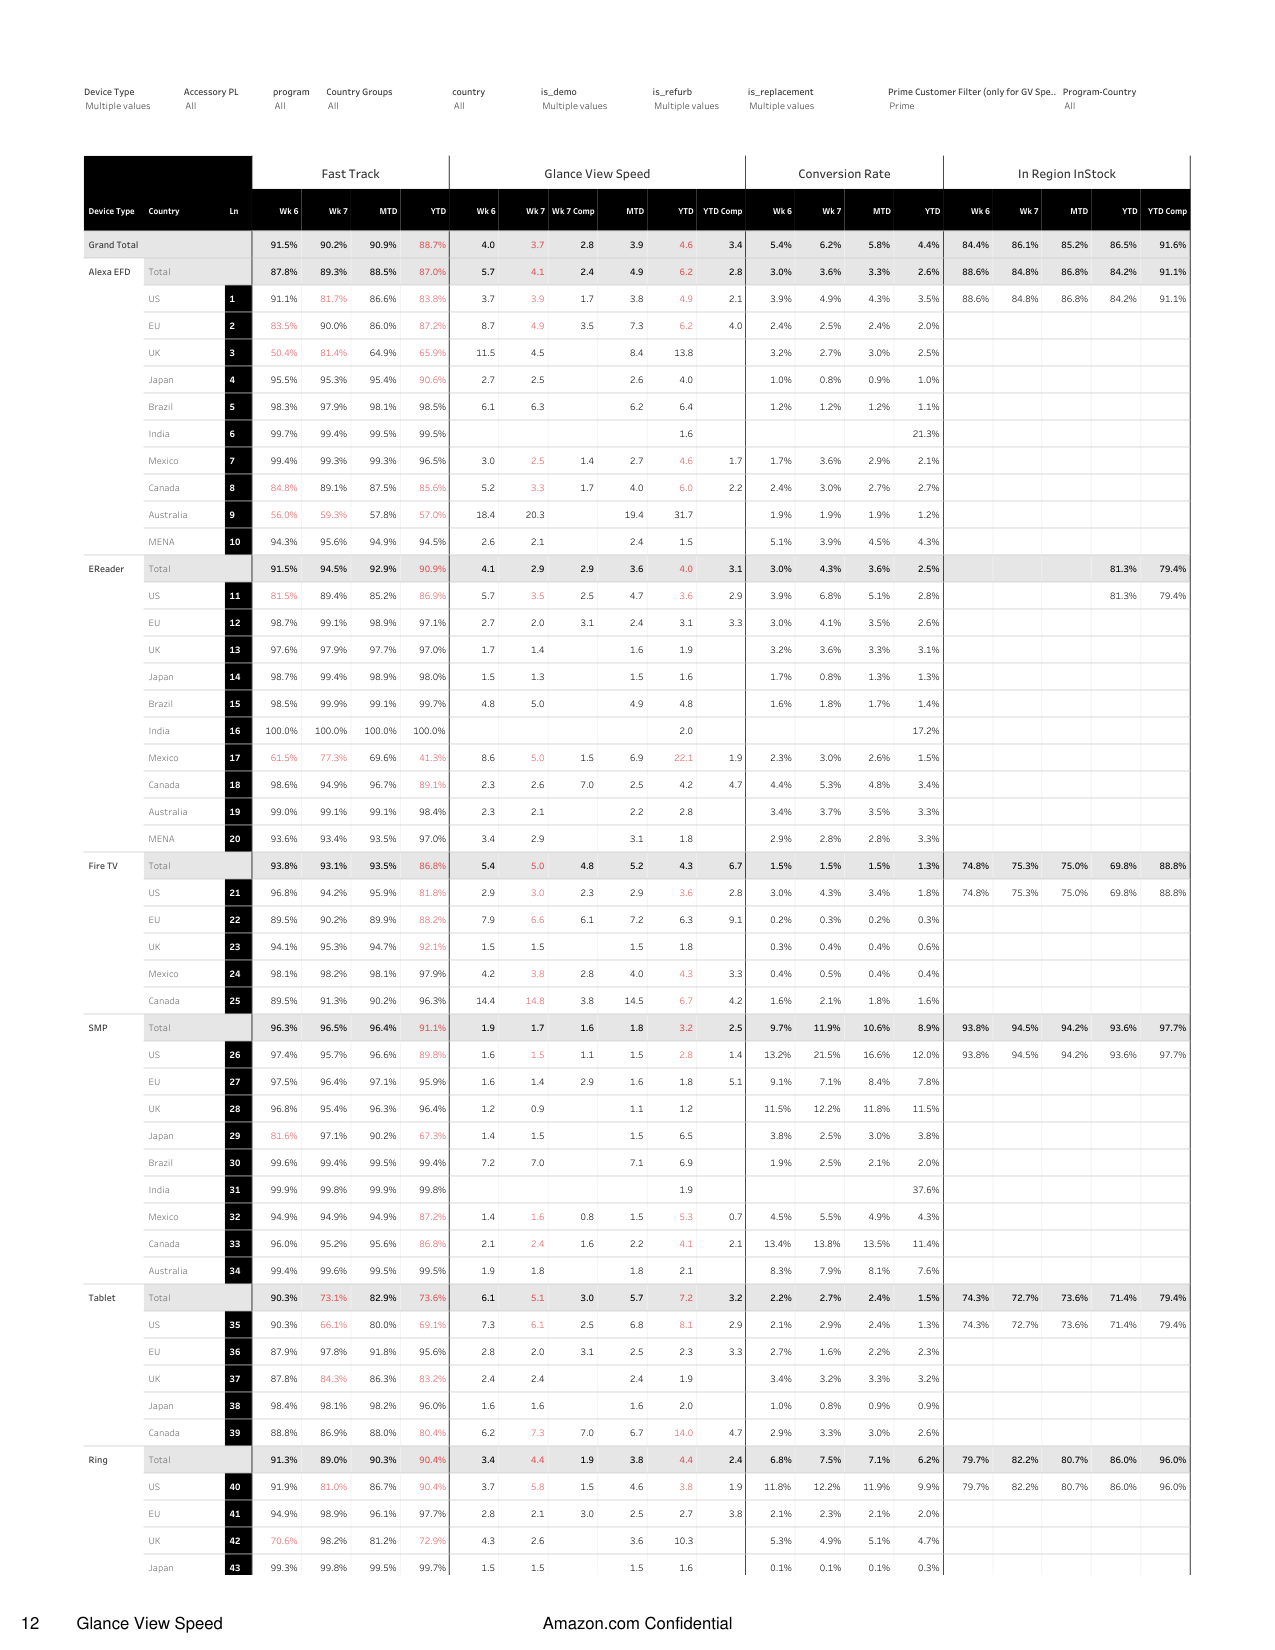
Glance View Speed
Lisa Martinez
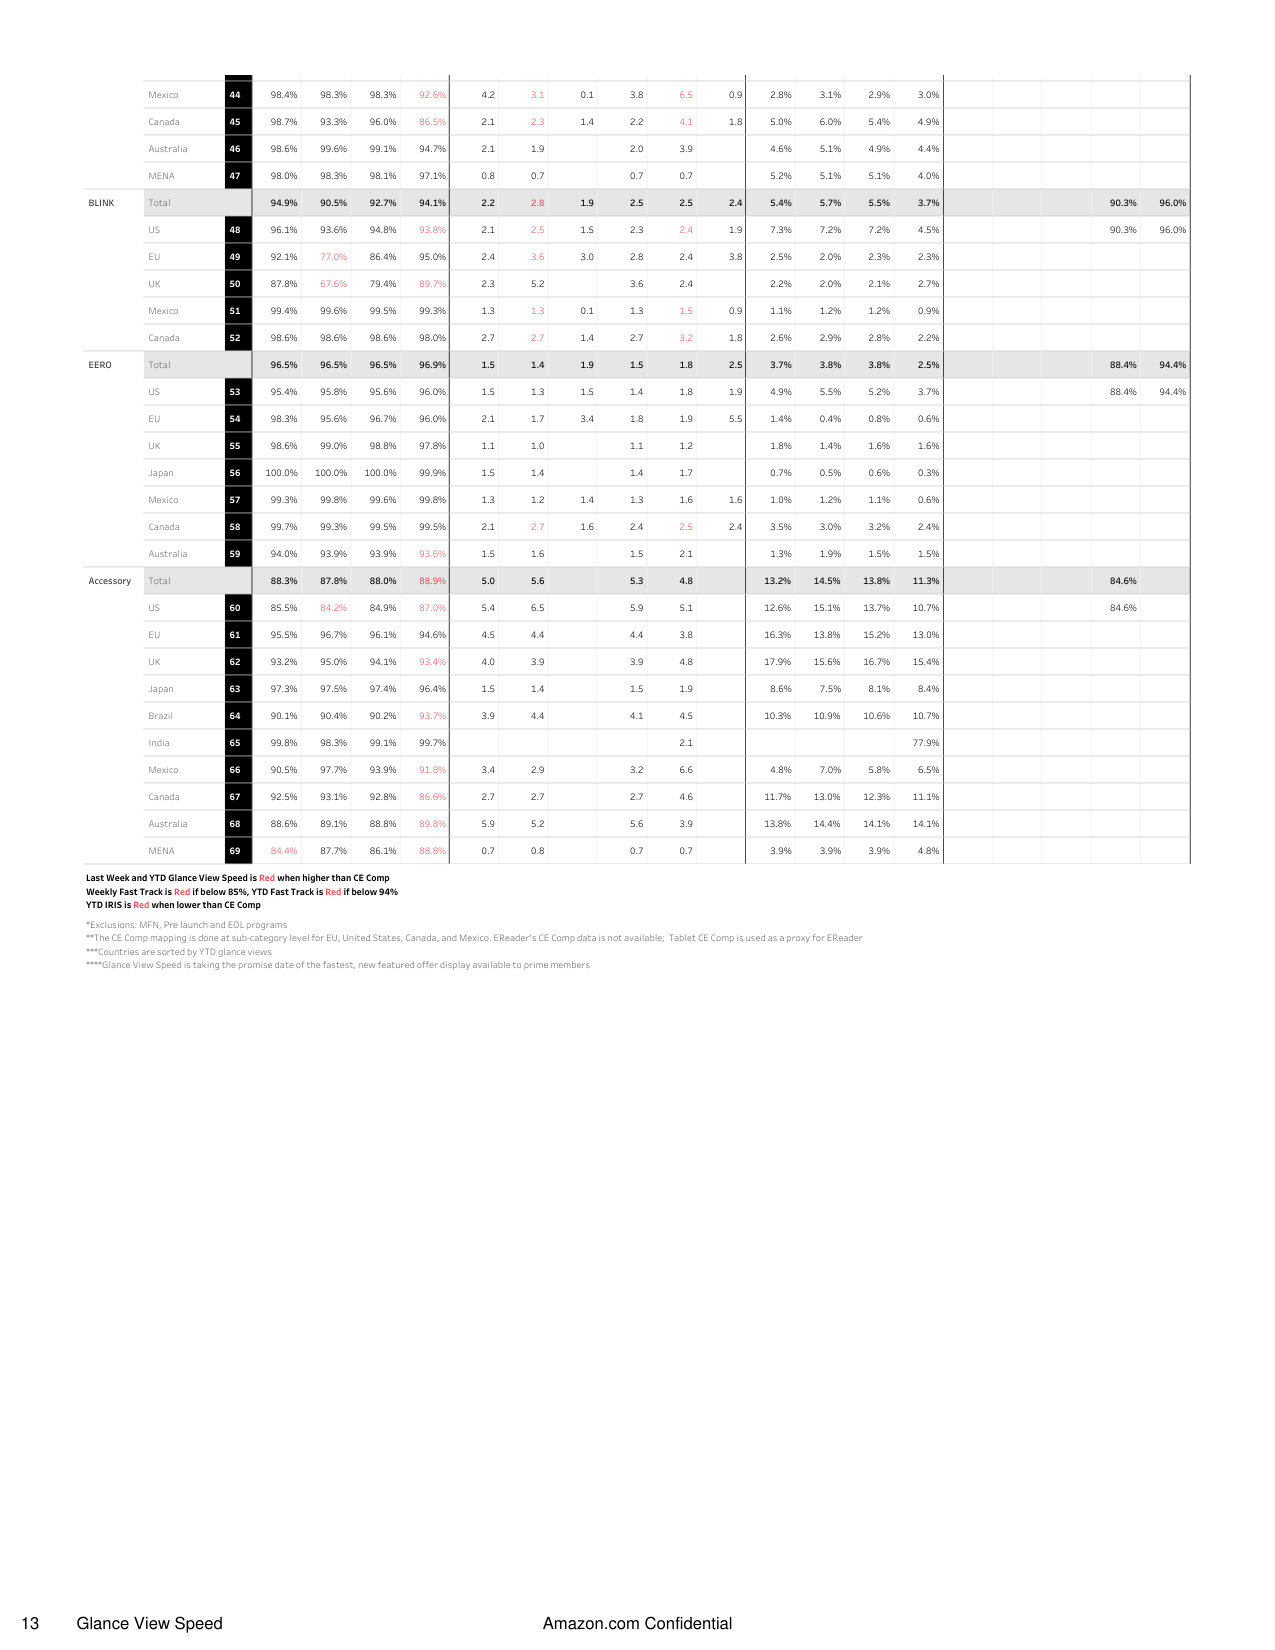
13.
Glance View Speed Details
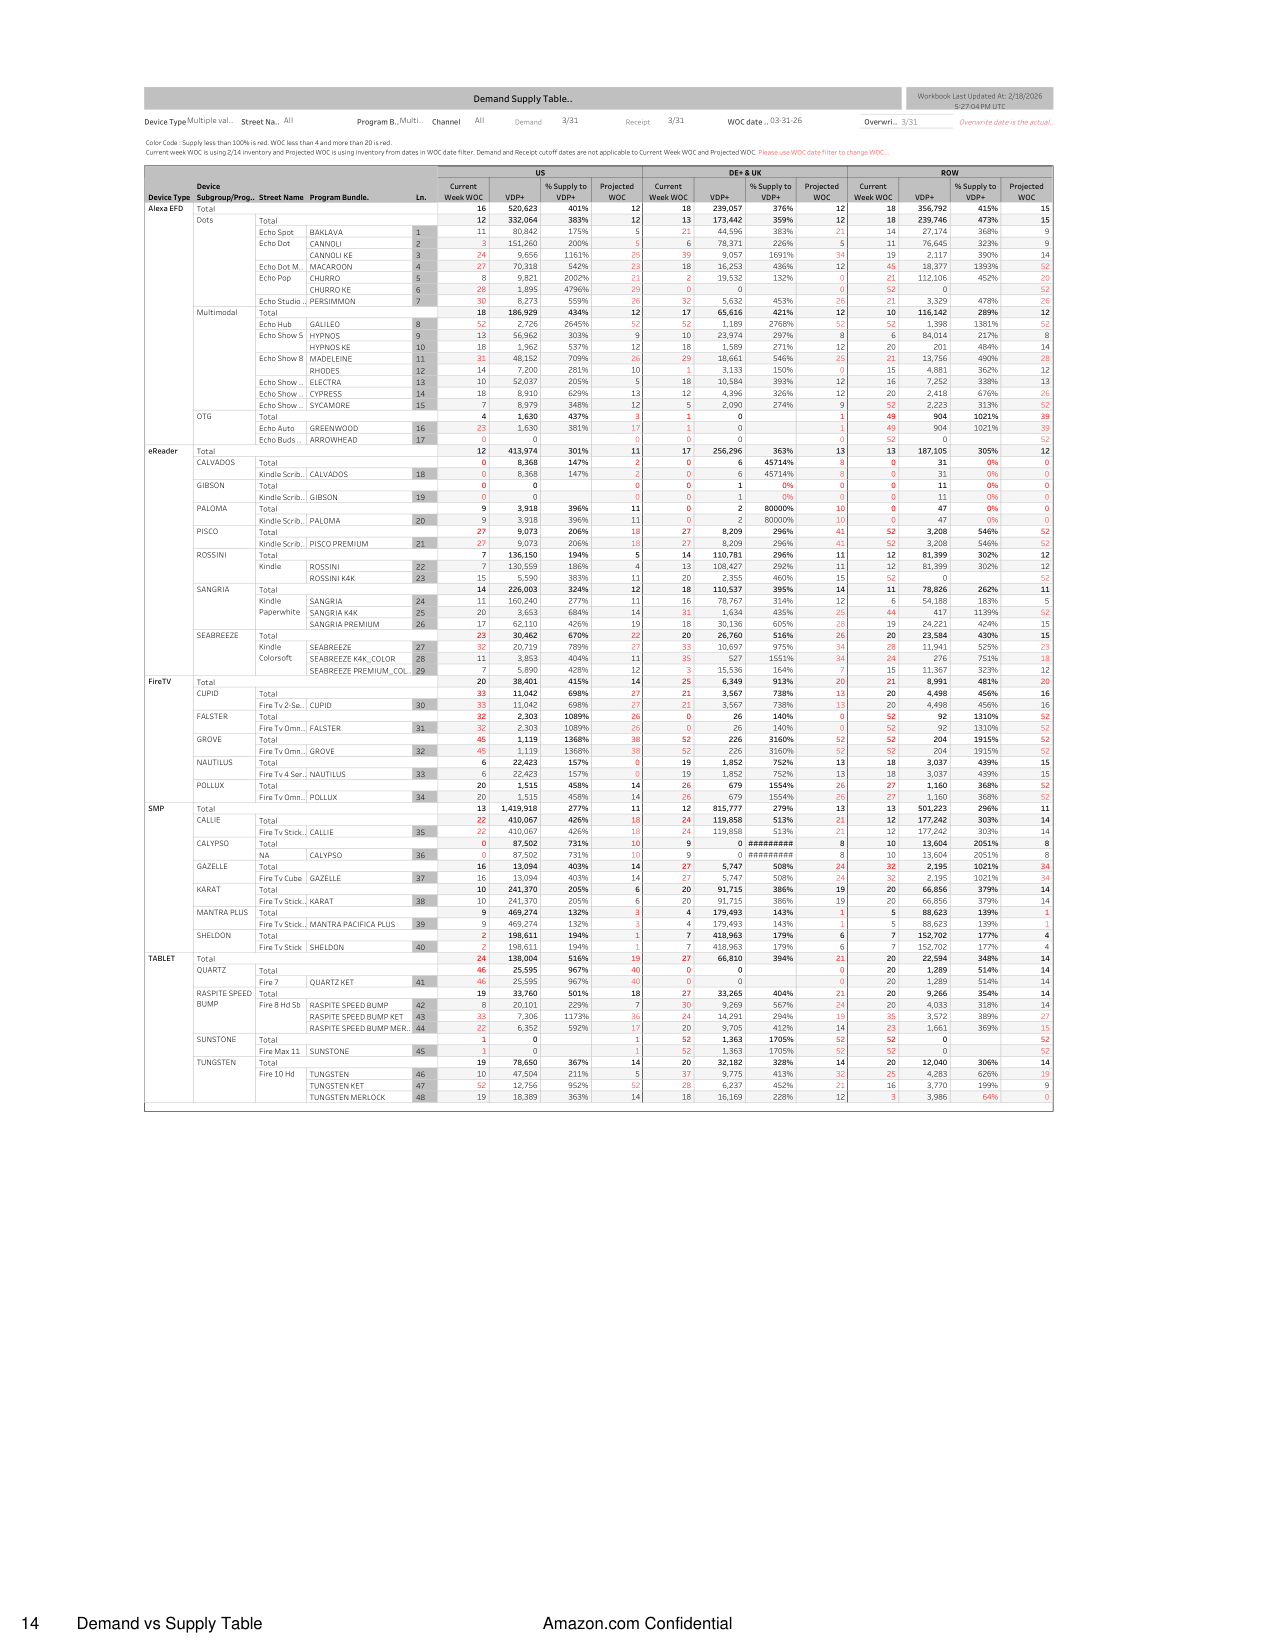
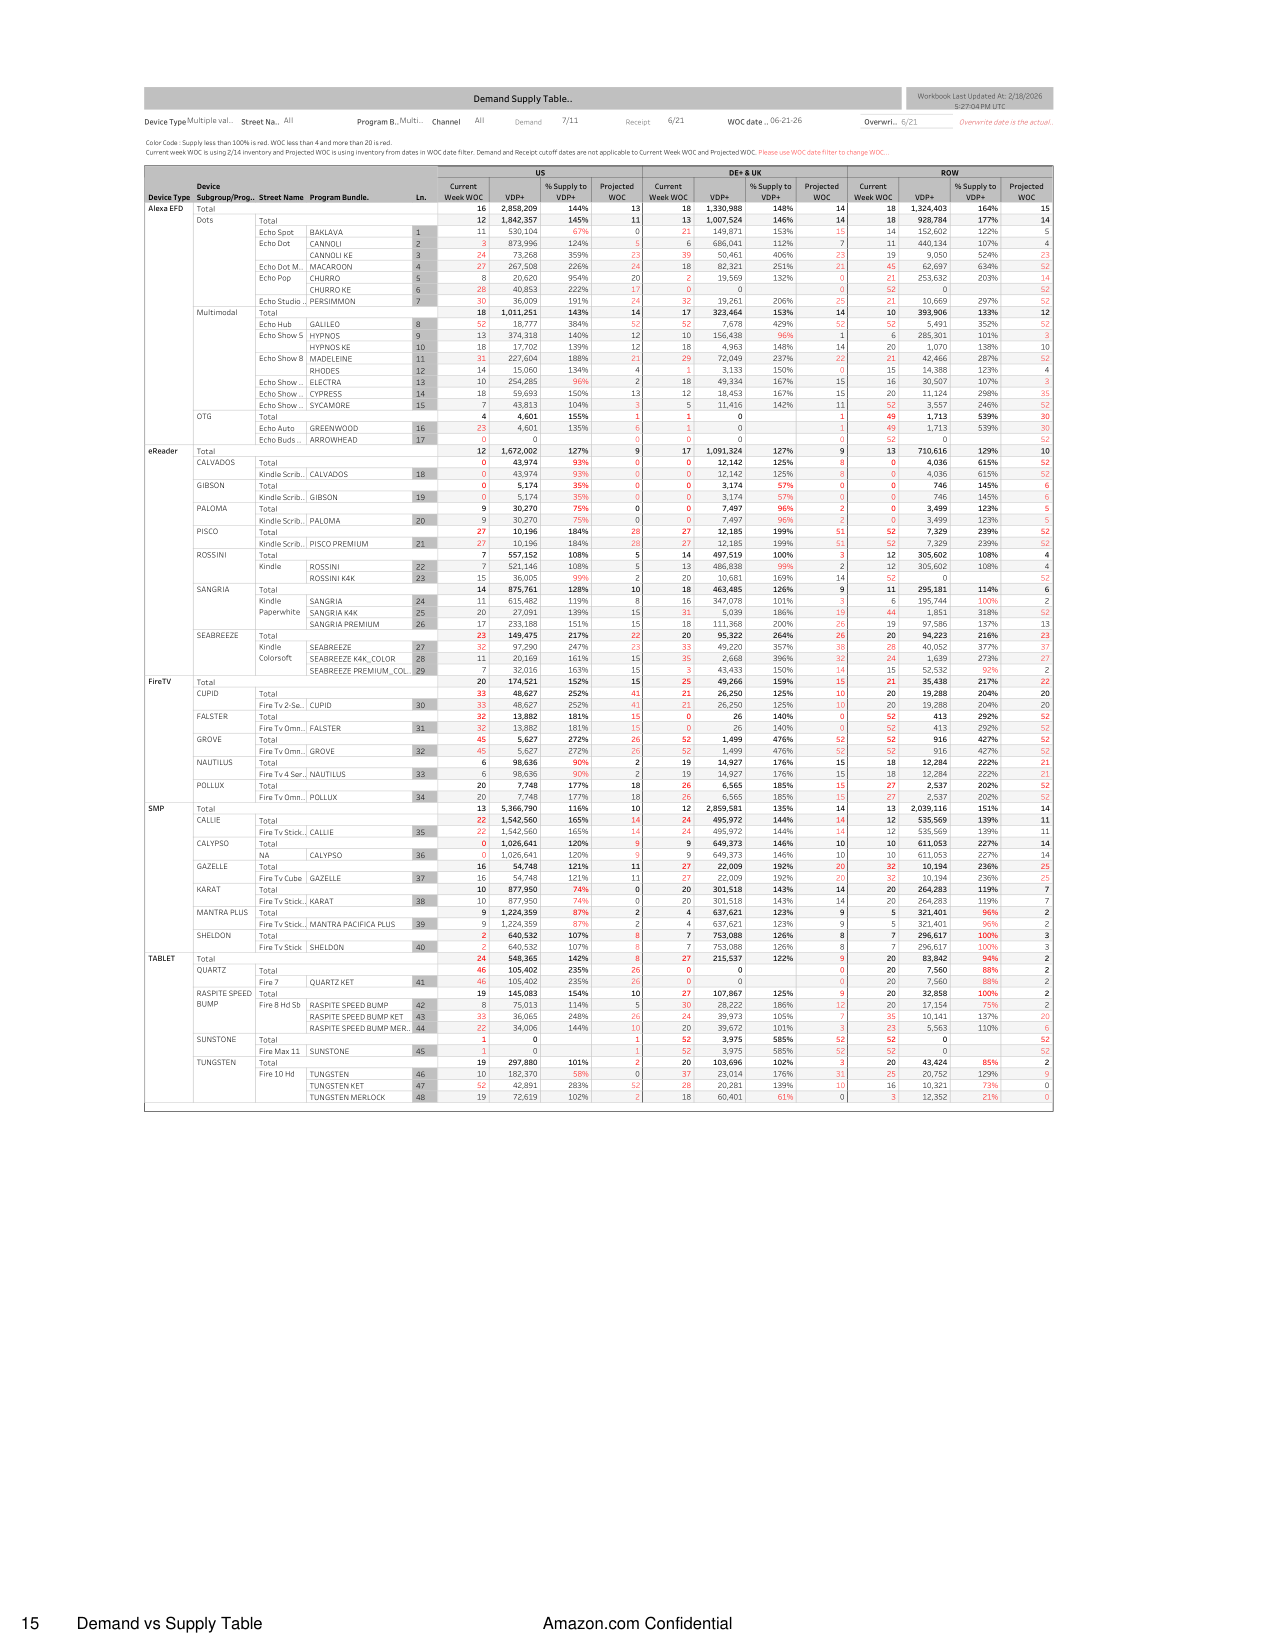
14.
Demand vs Supply Table
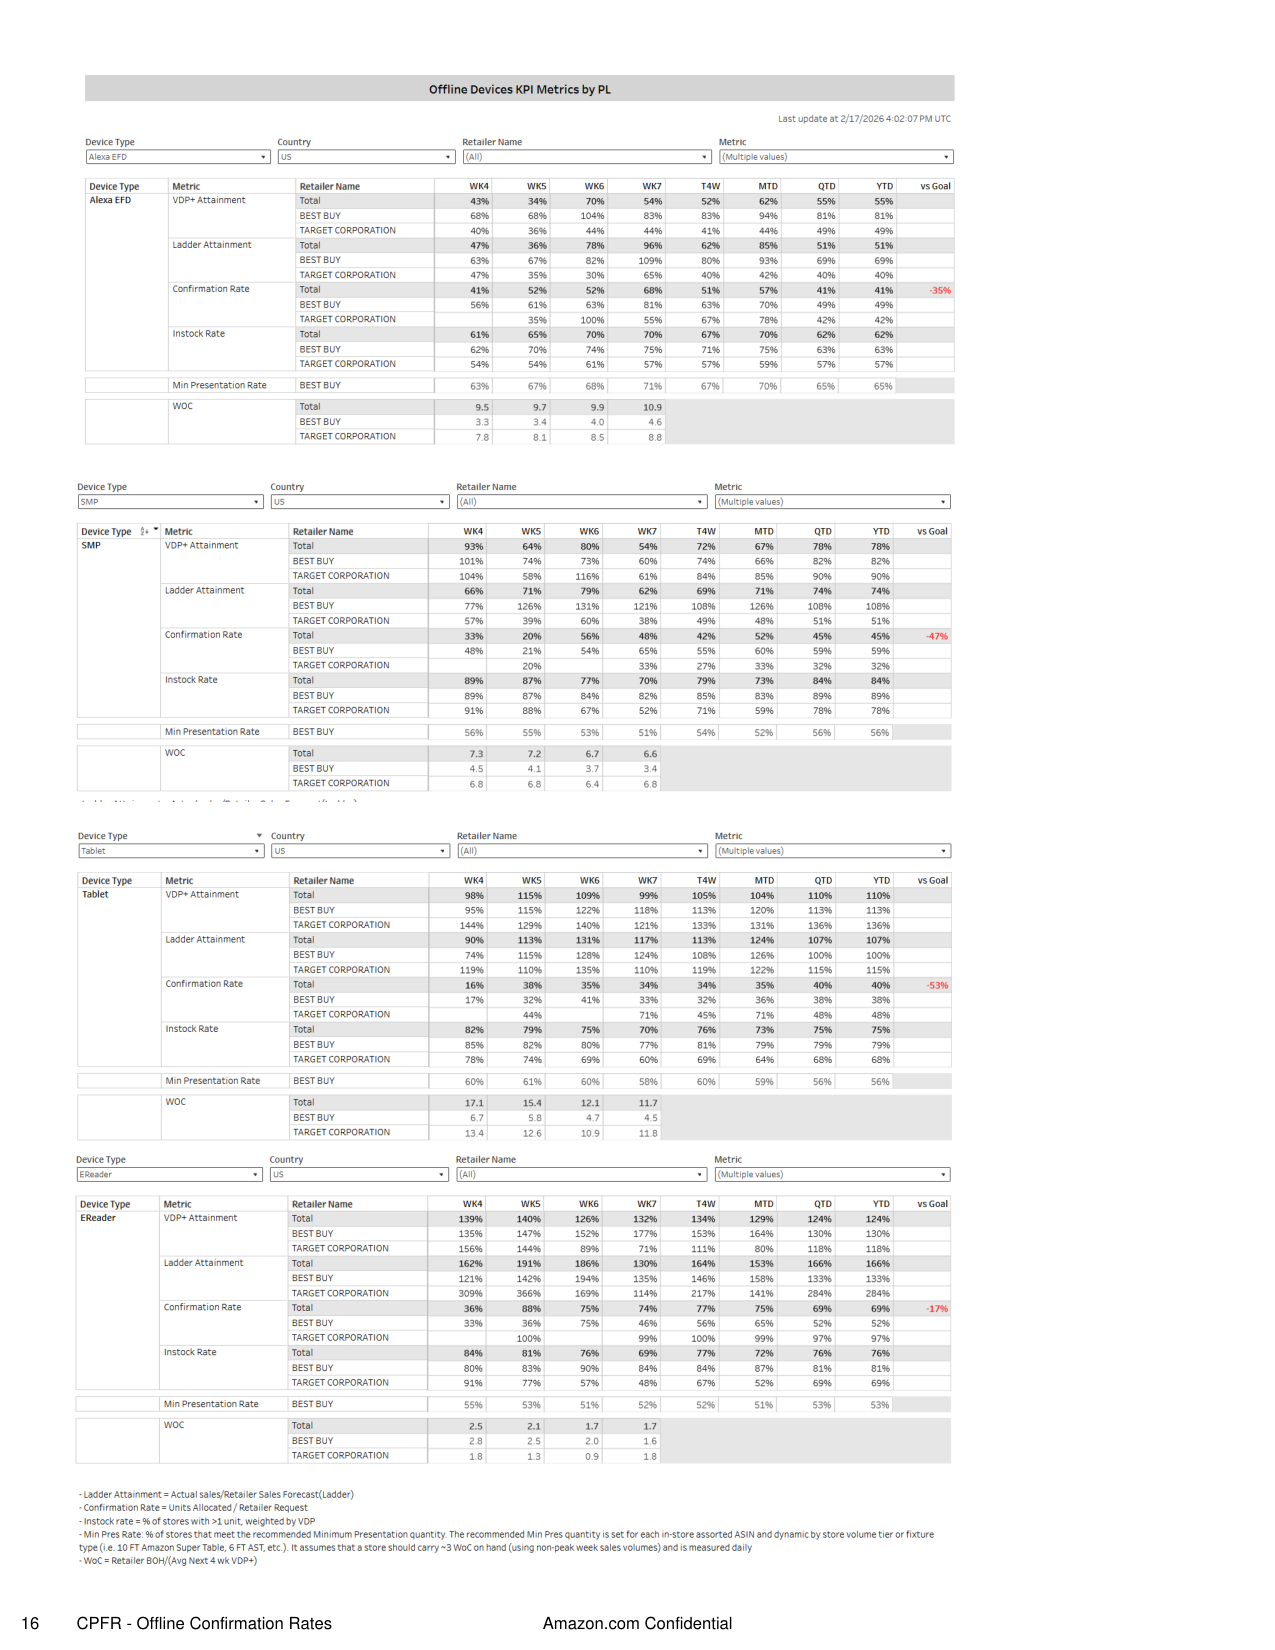
15.
CPFR - Offline Confirmation Rates
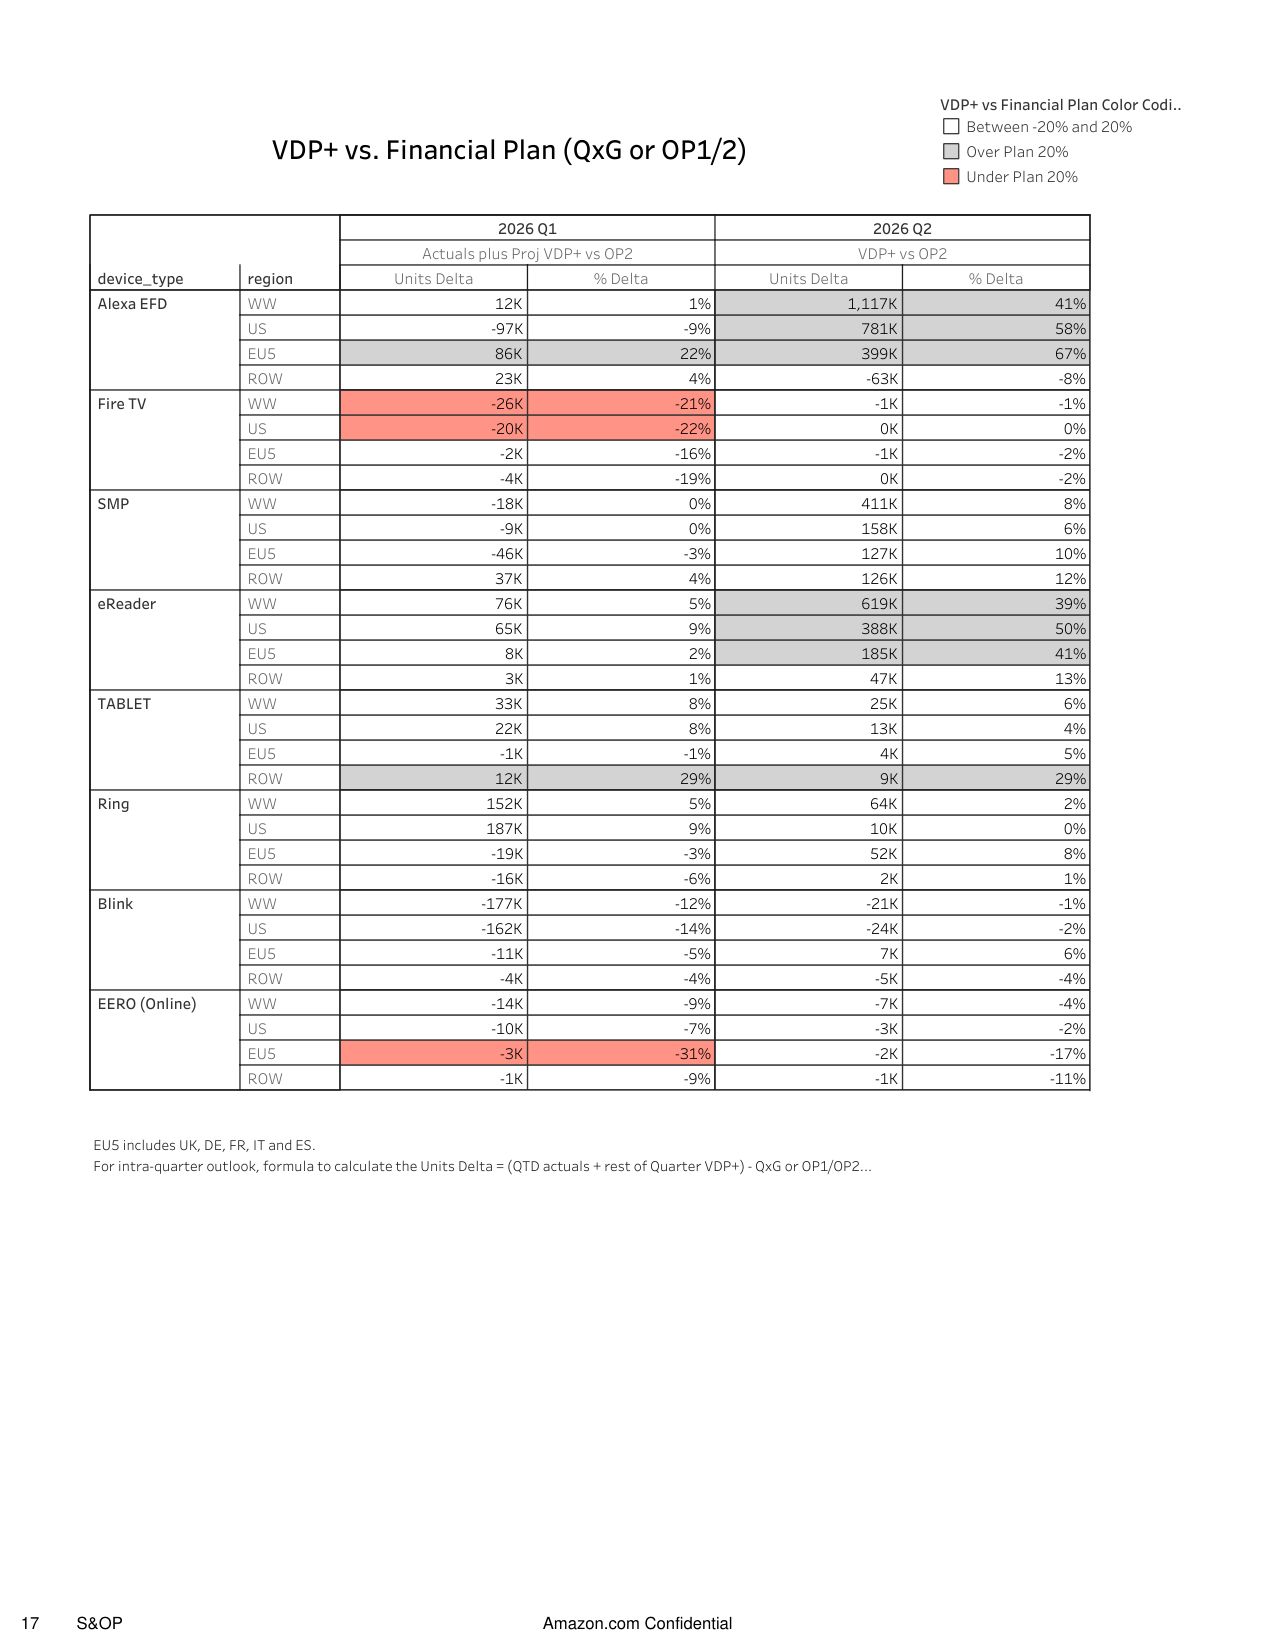
16.
S&OP
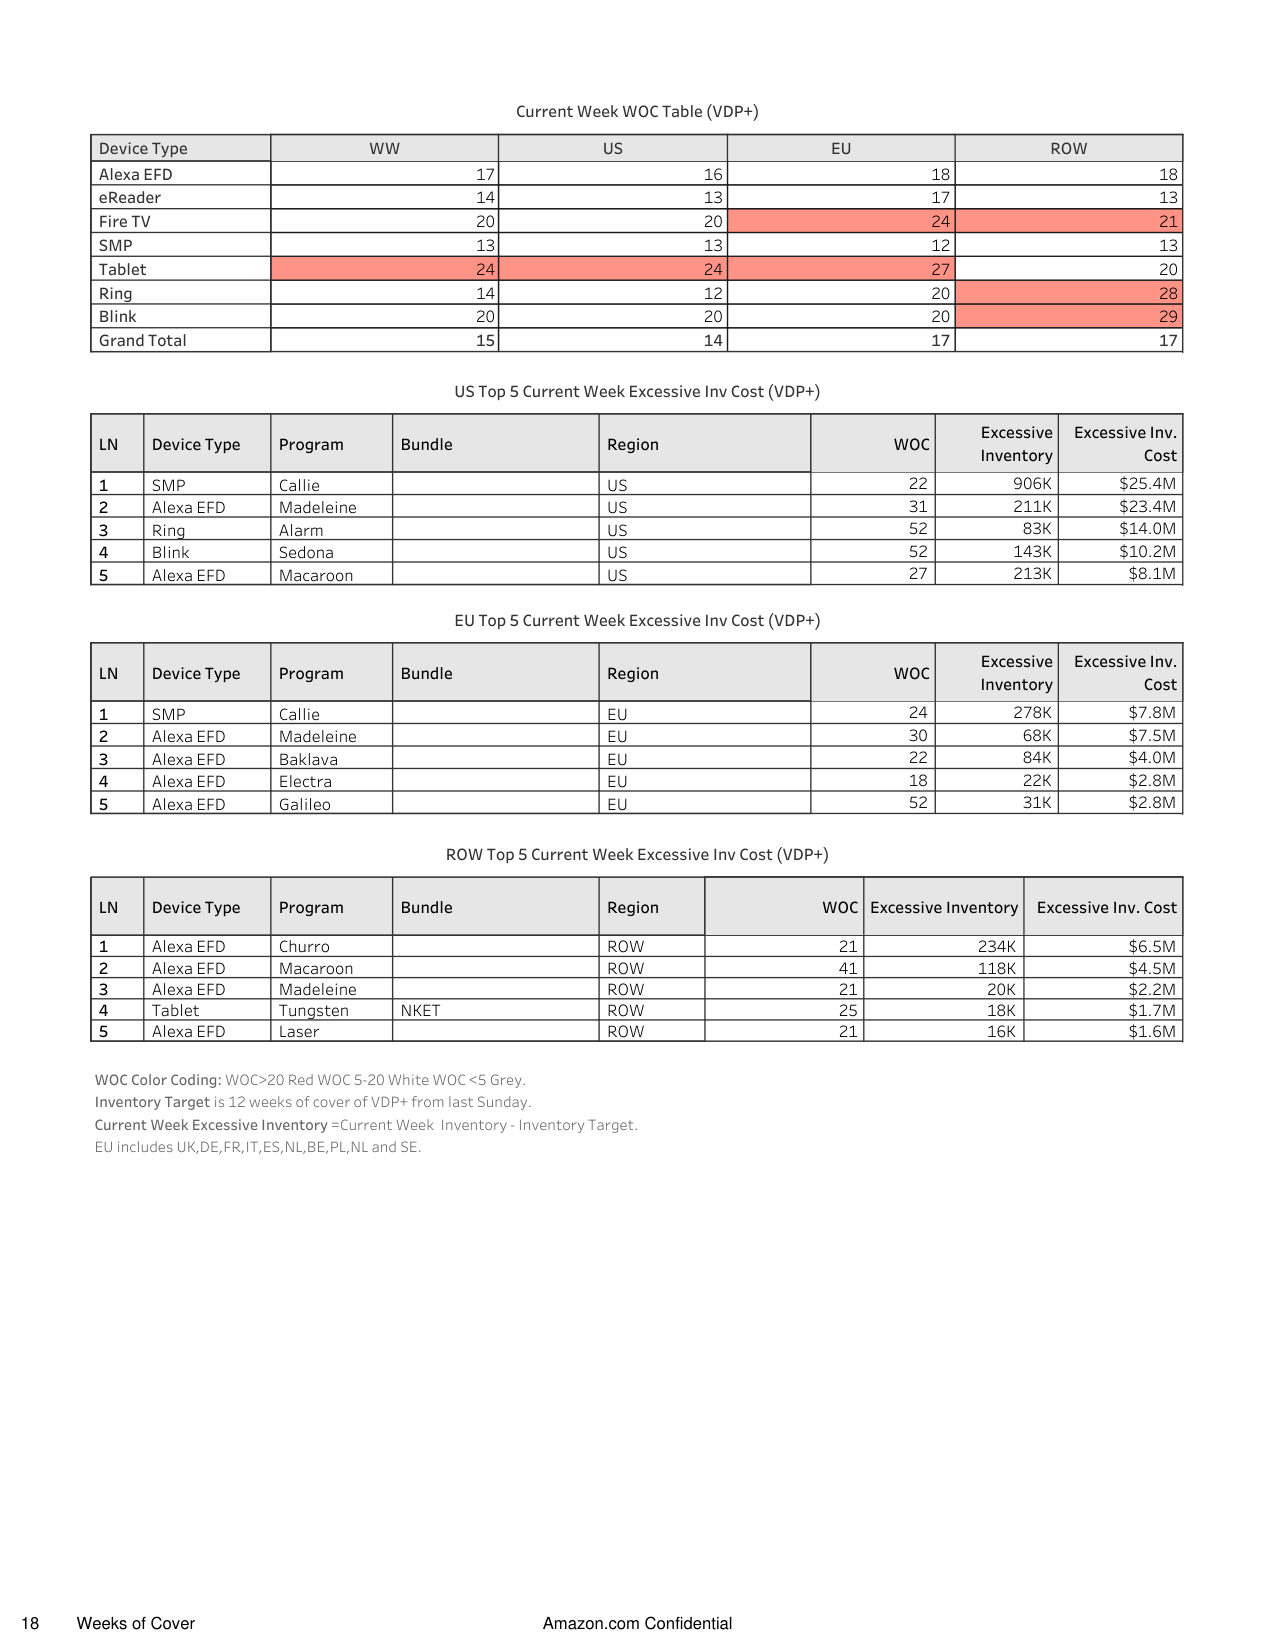
17.
Weeks of Cover
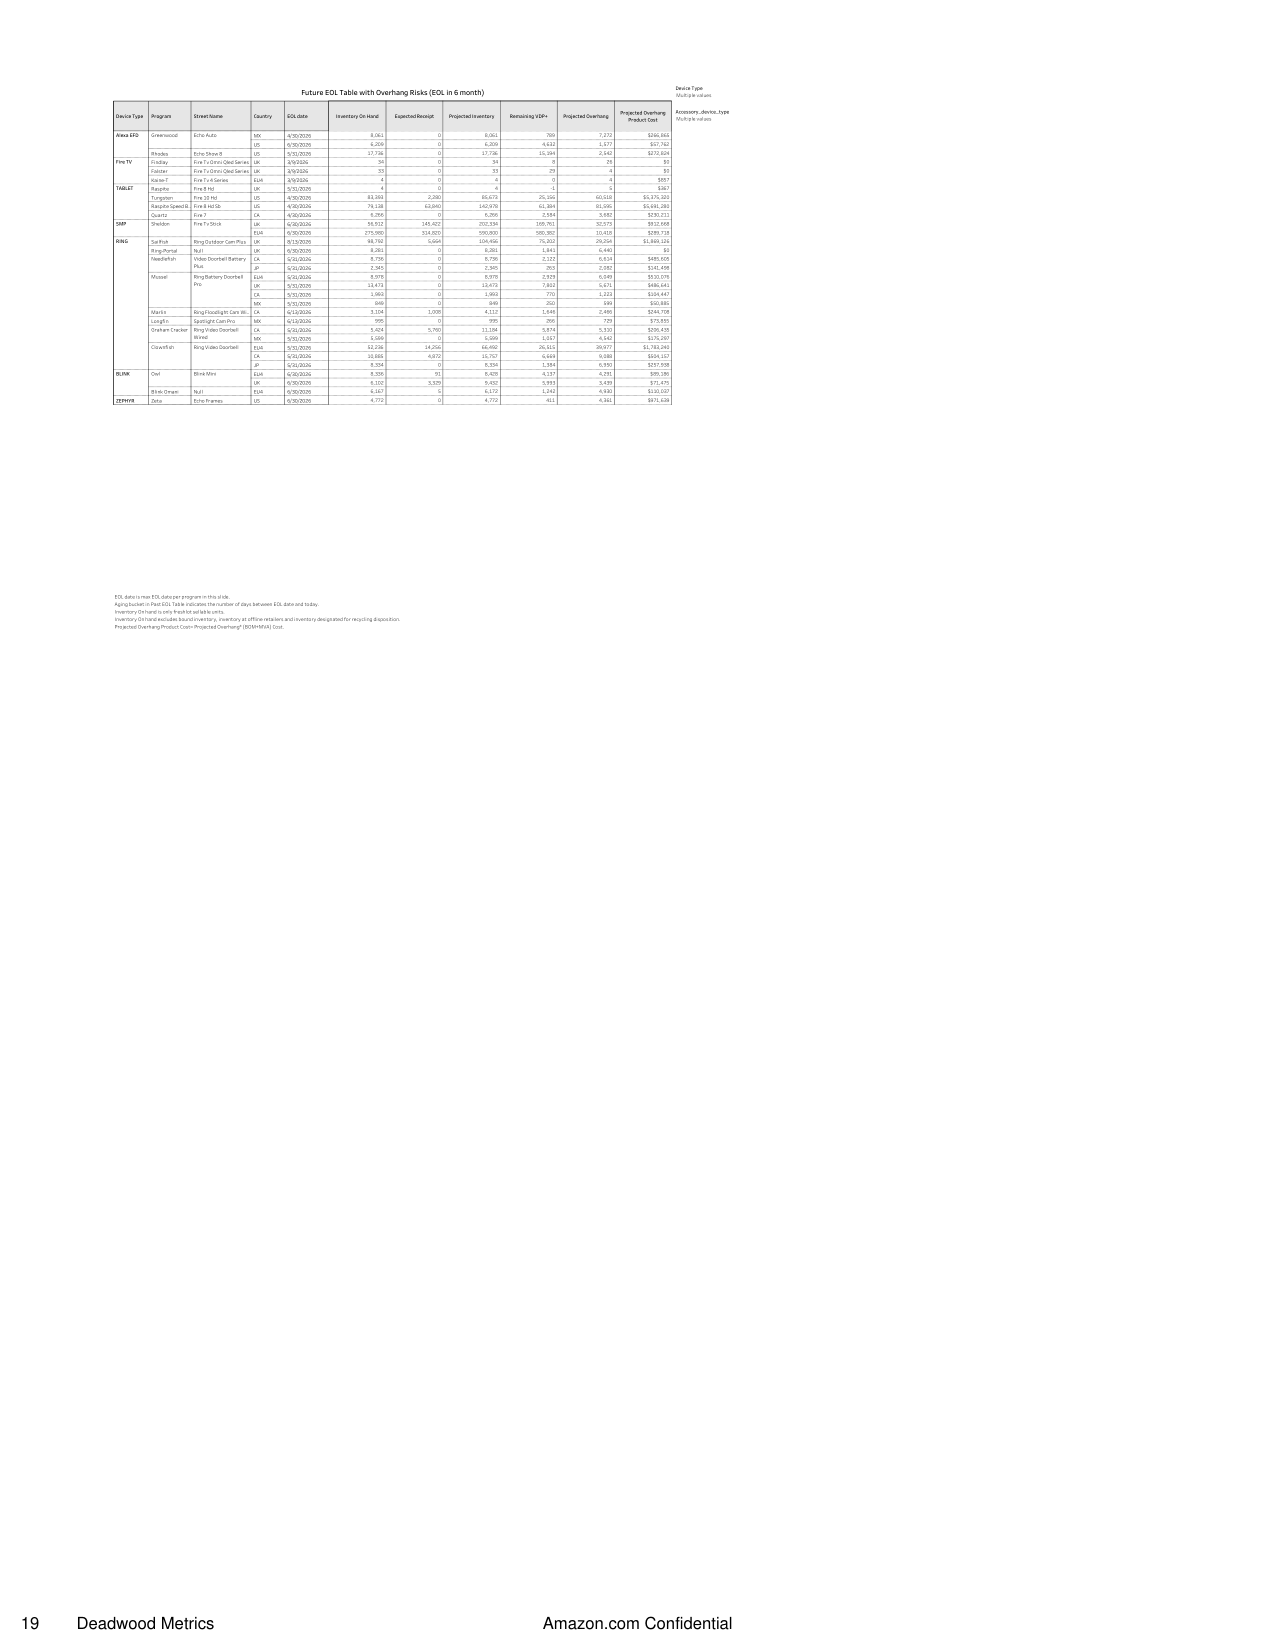
18.
Deadwood Metrics
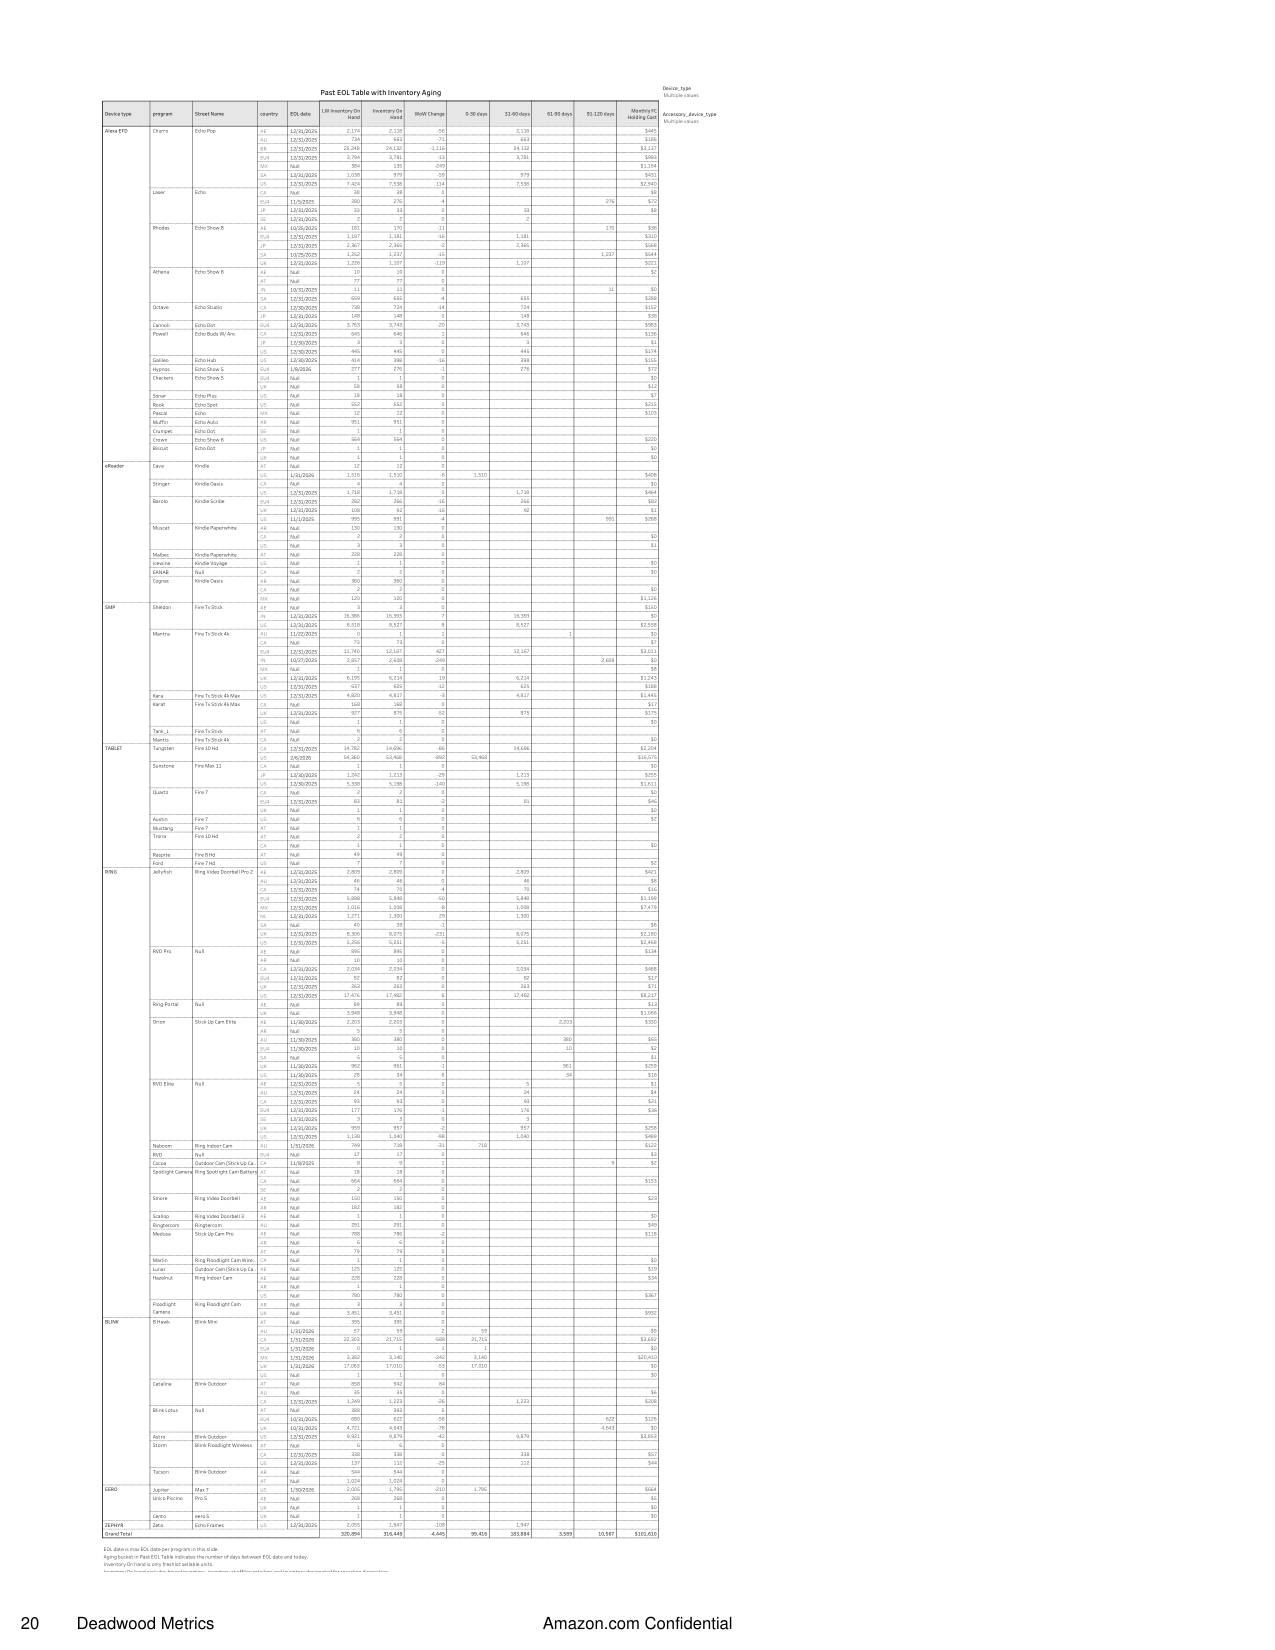
19.
Deadwood Metrics - Past EOL
20.
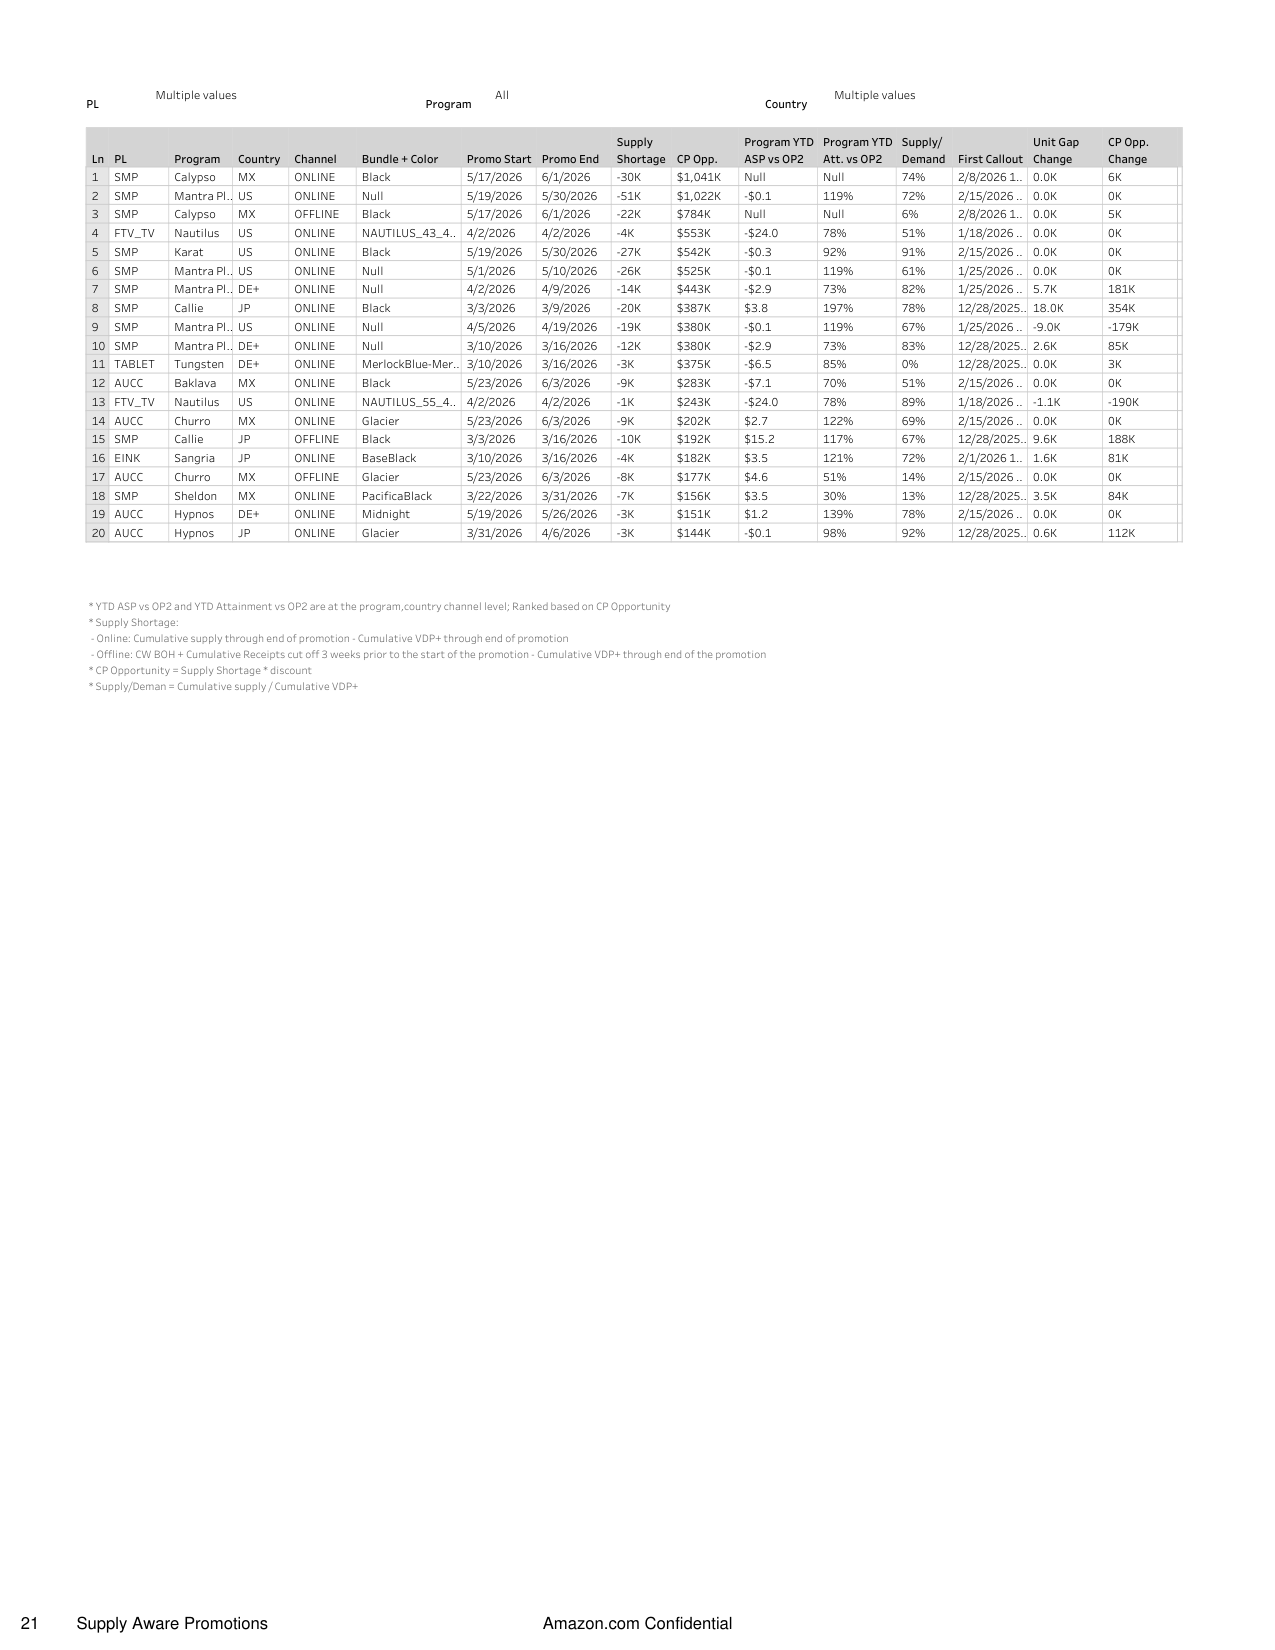
Supply Aware Promotions
21.
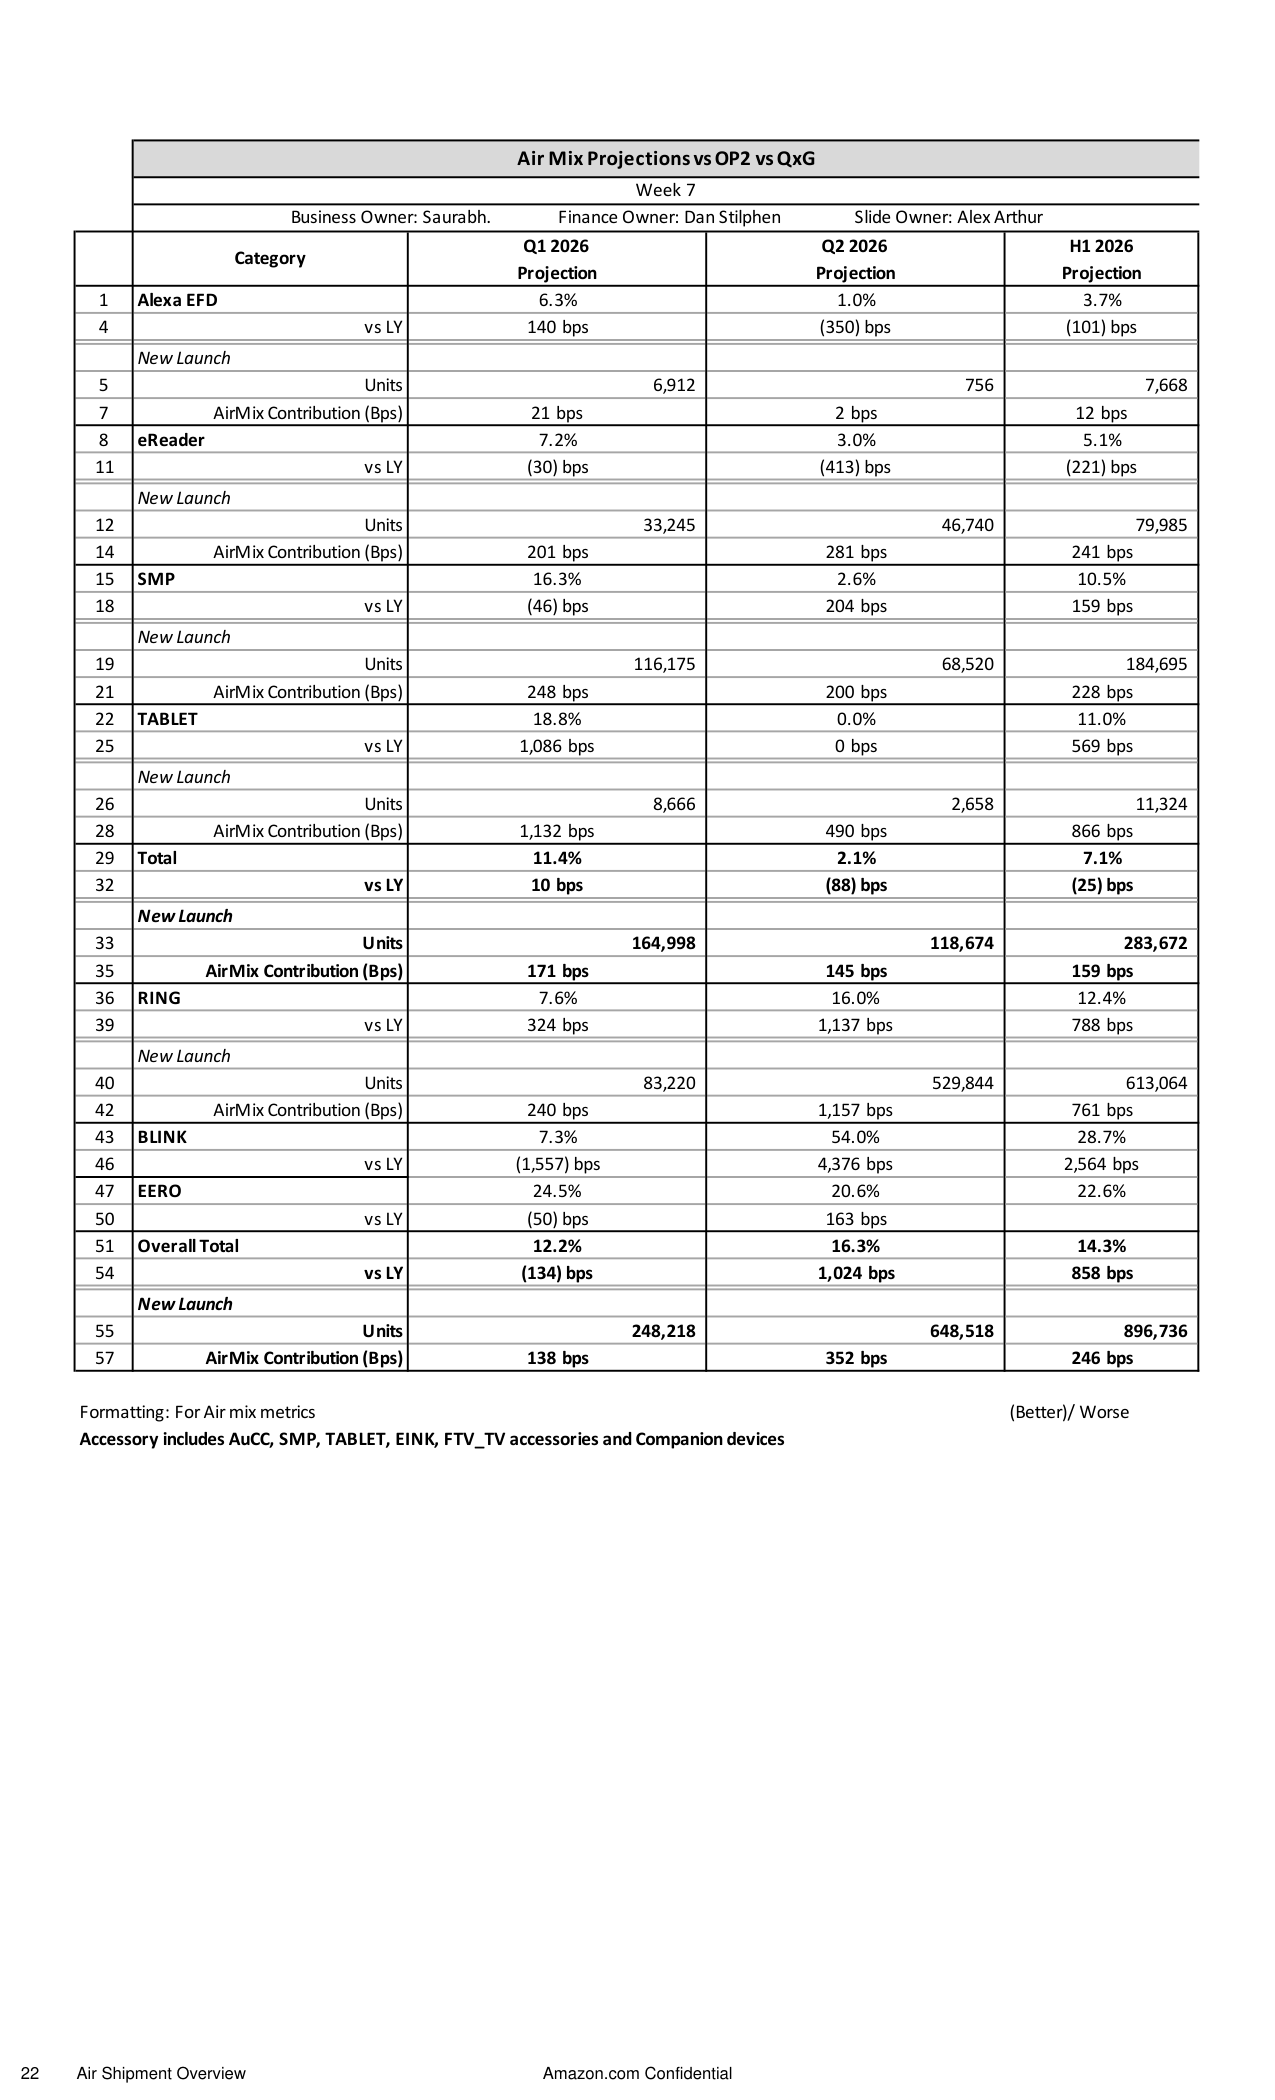
Air Shipment Overview
22.
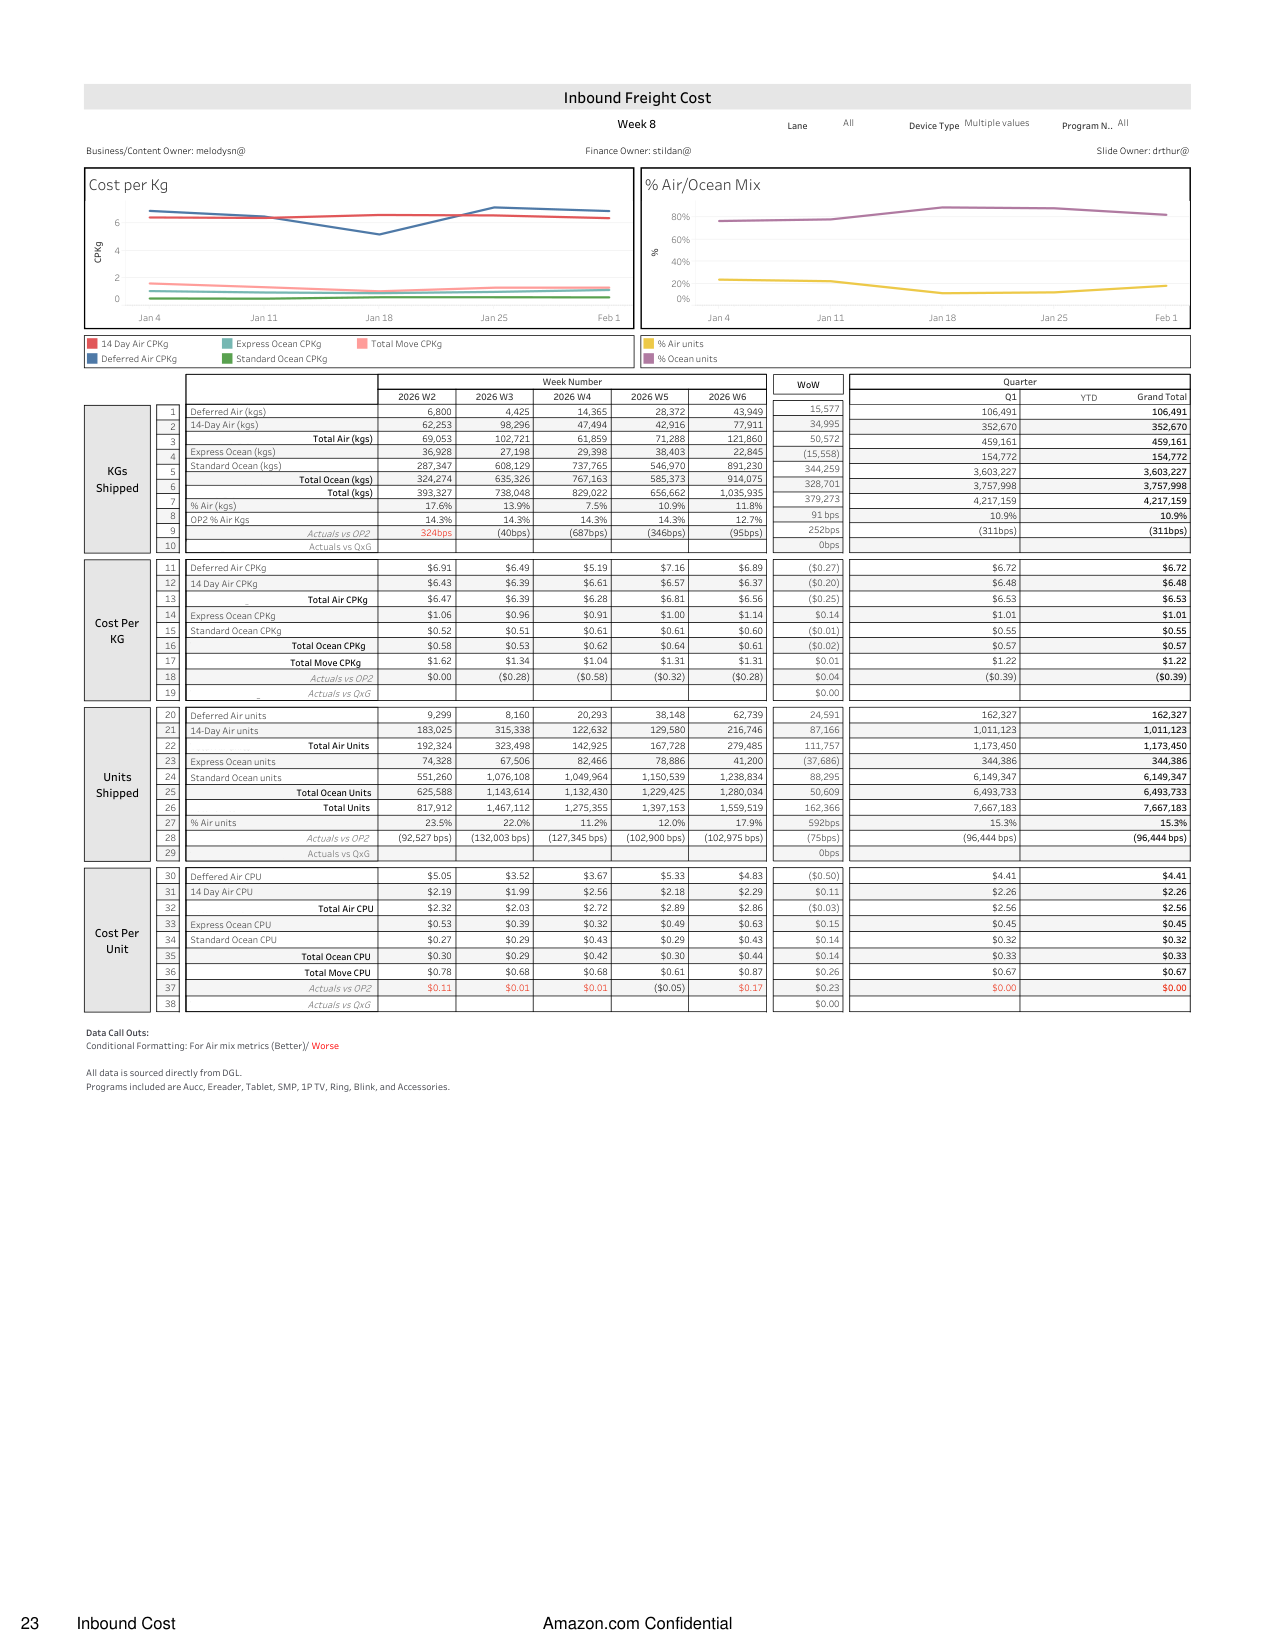
Inbound Cost
23.
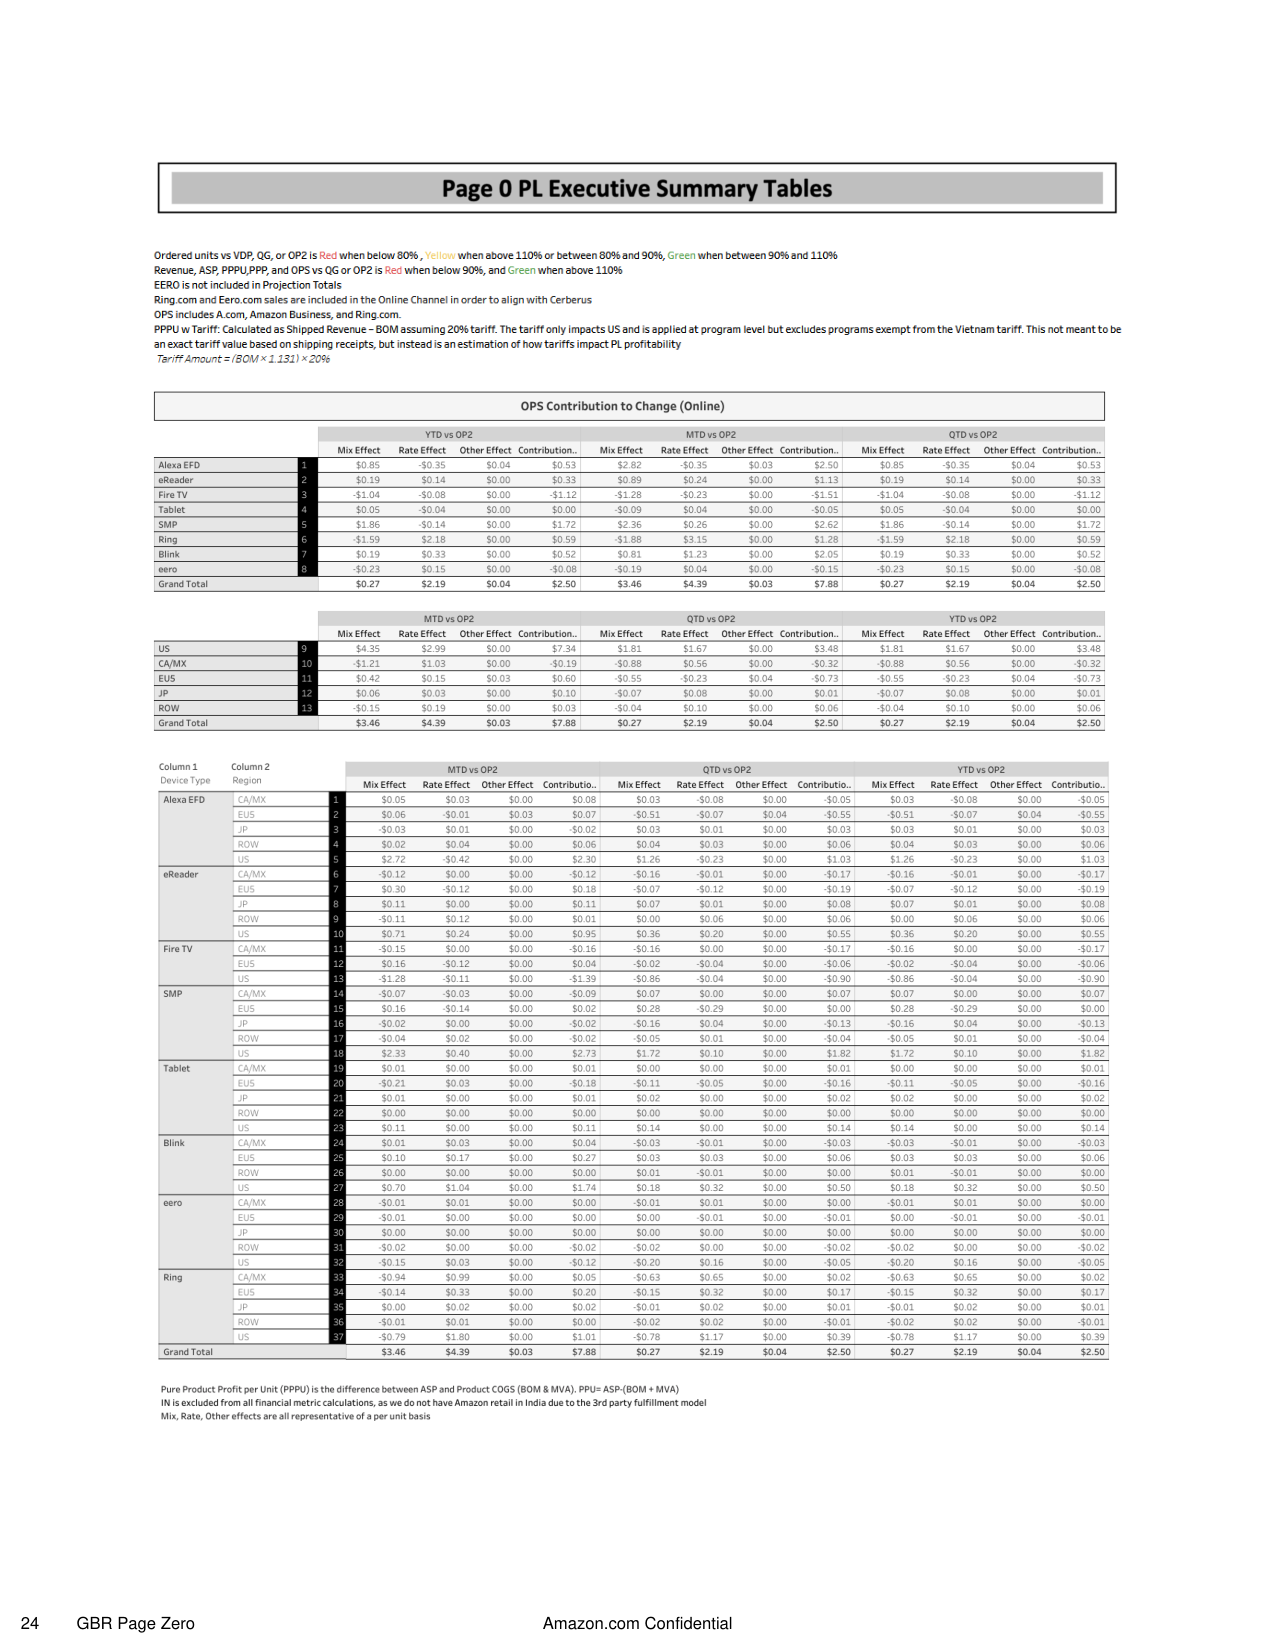
GBR Page Zero
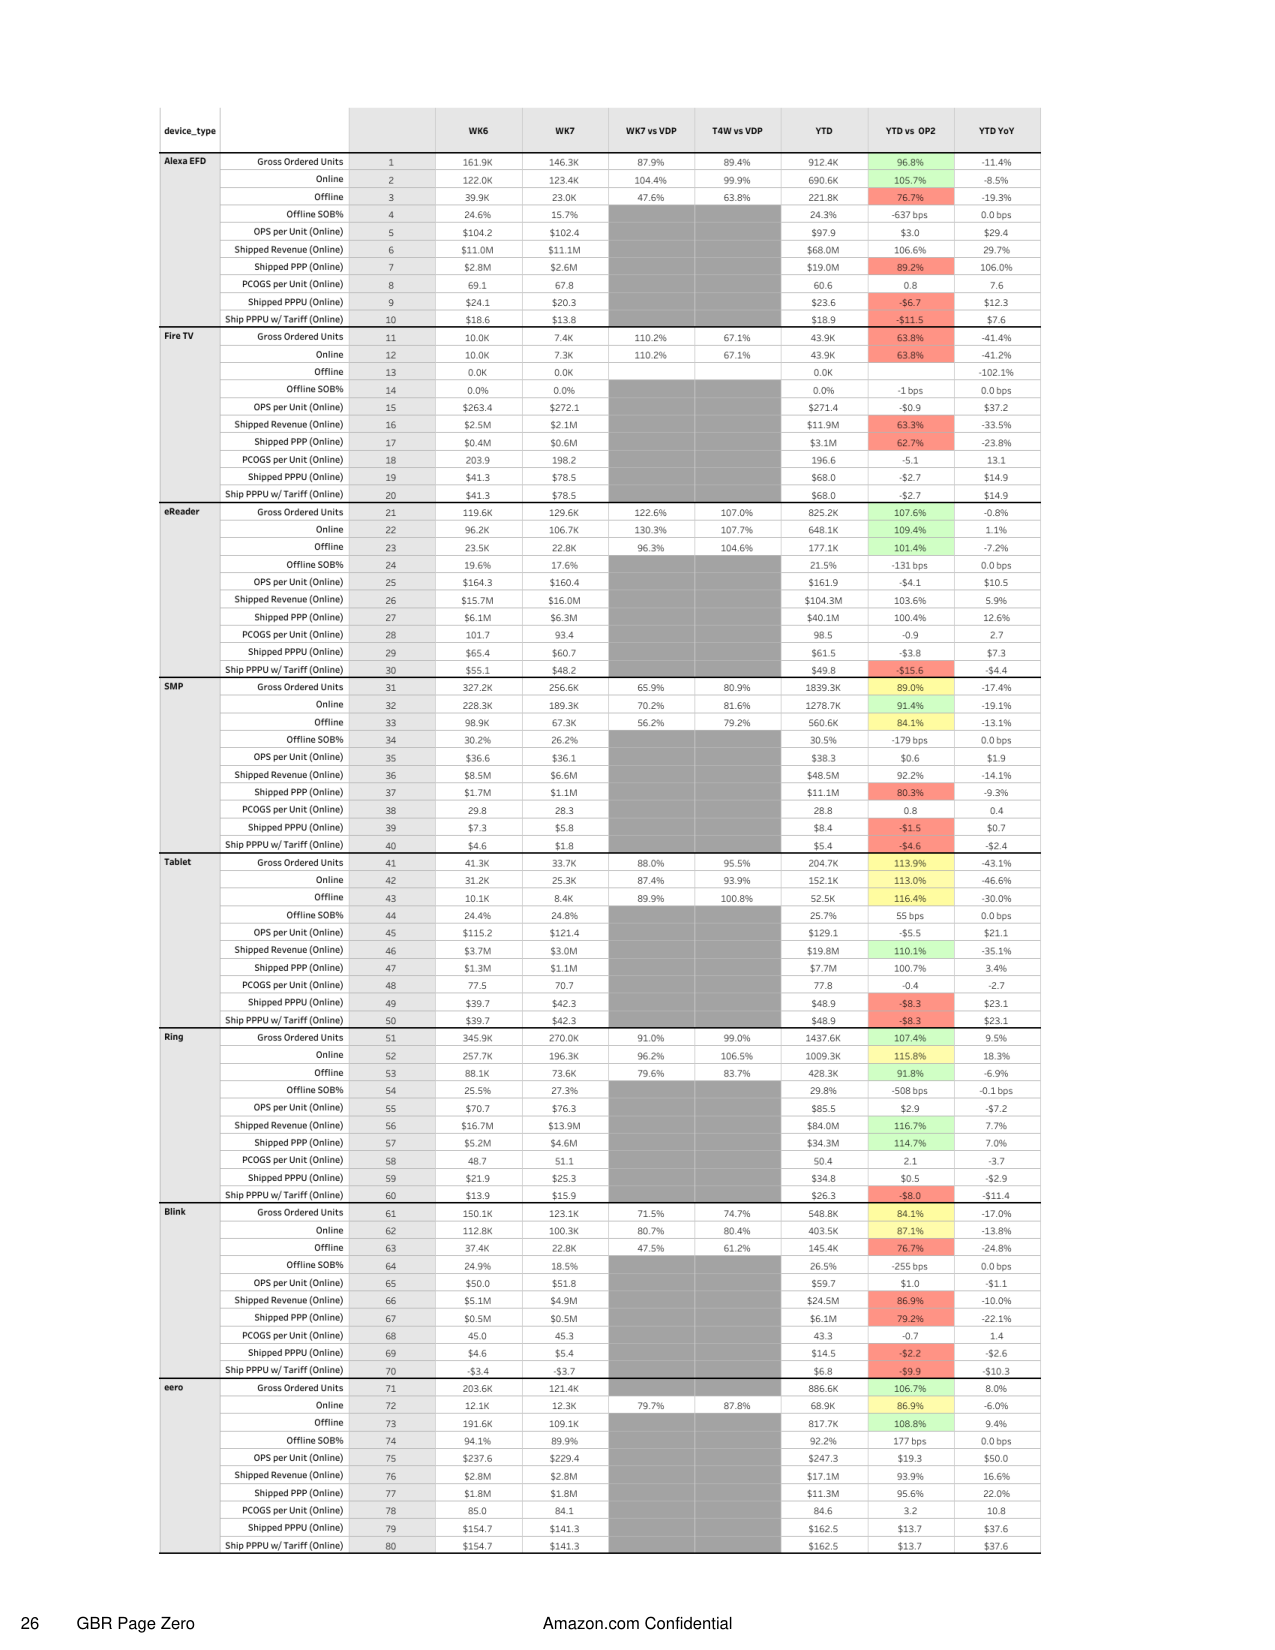
24.
GBR Page Zero - Device Performance
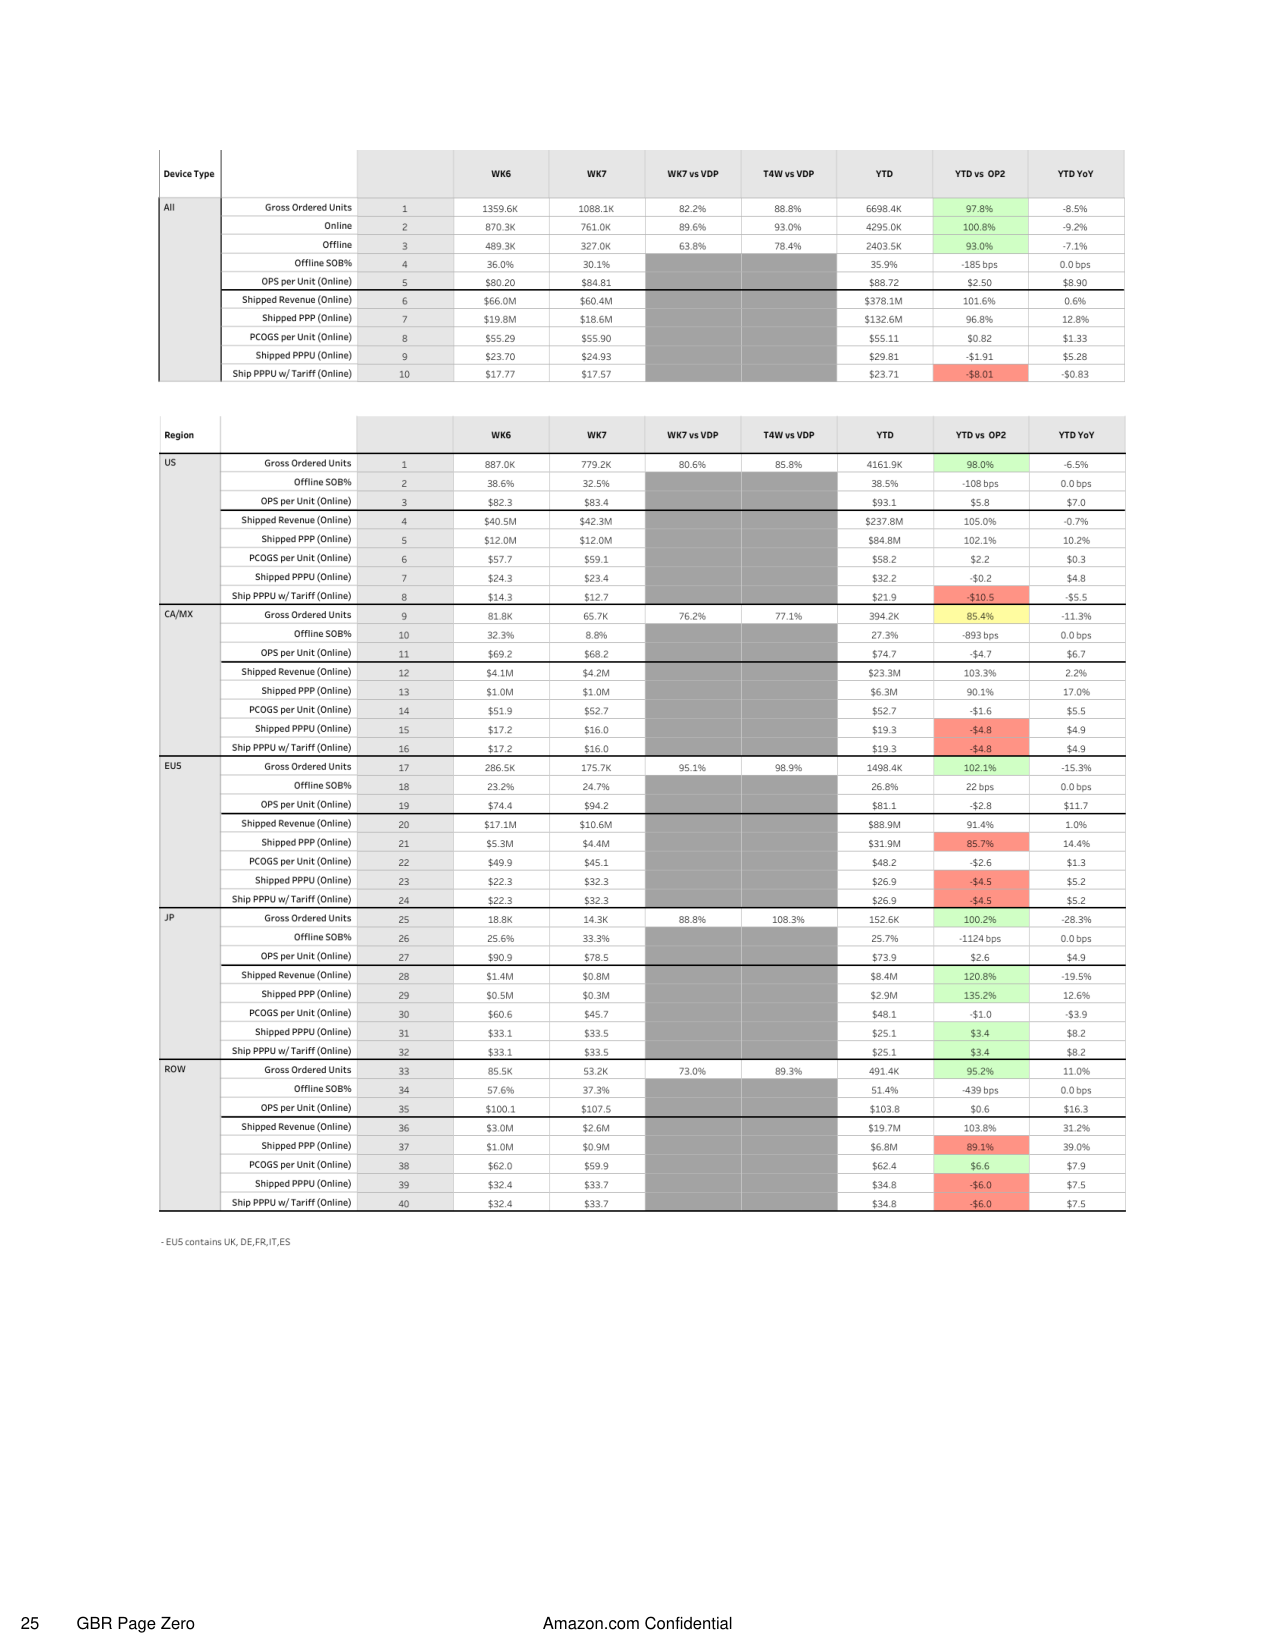
25.
GBR Page Zero - Regional...
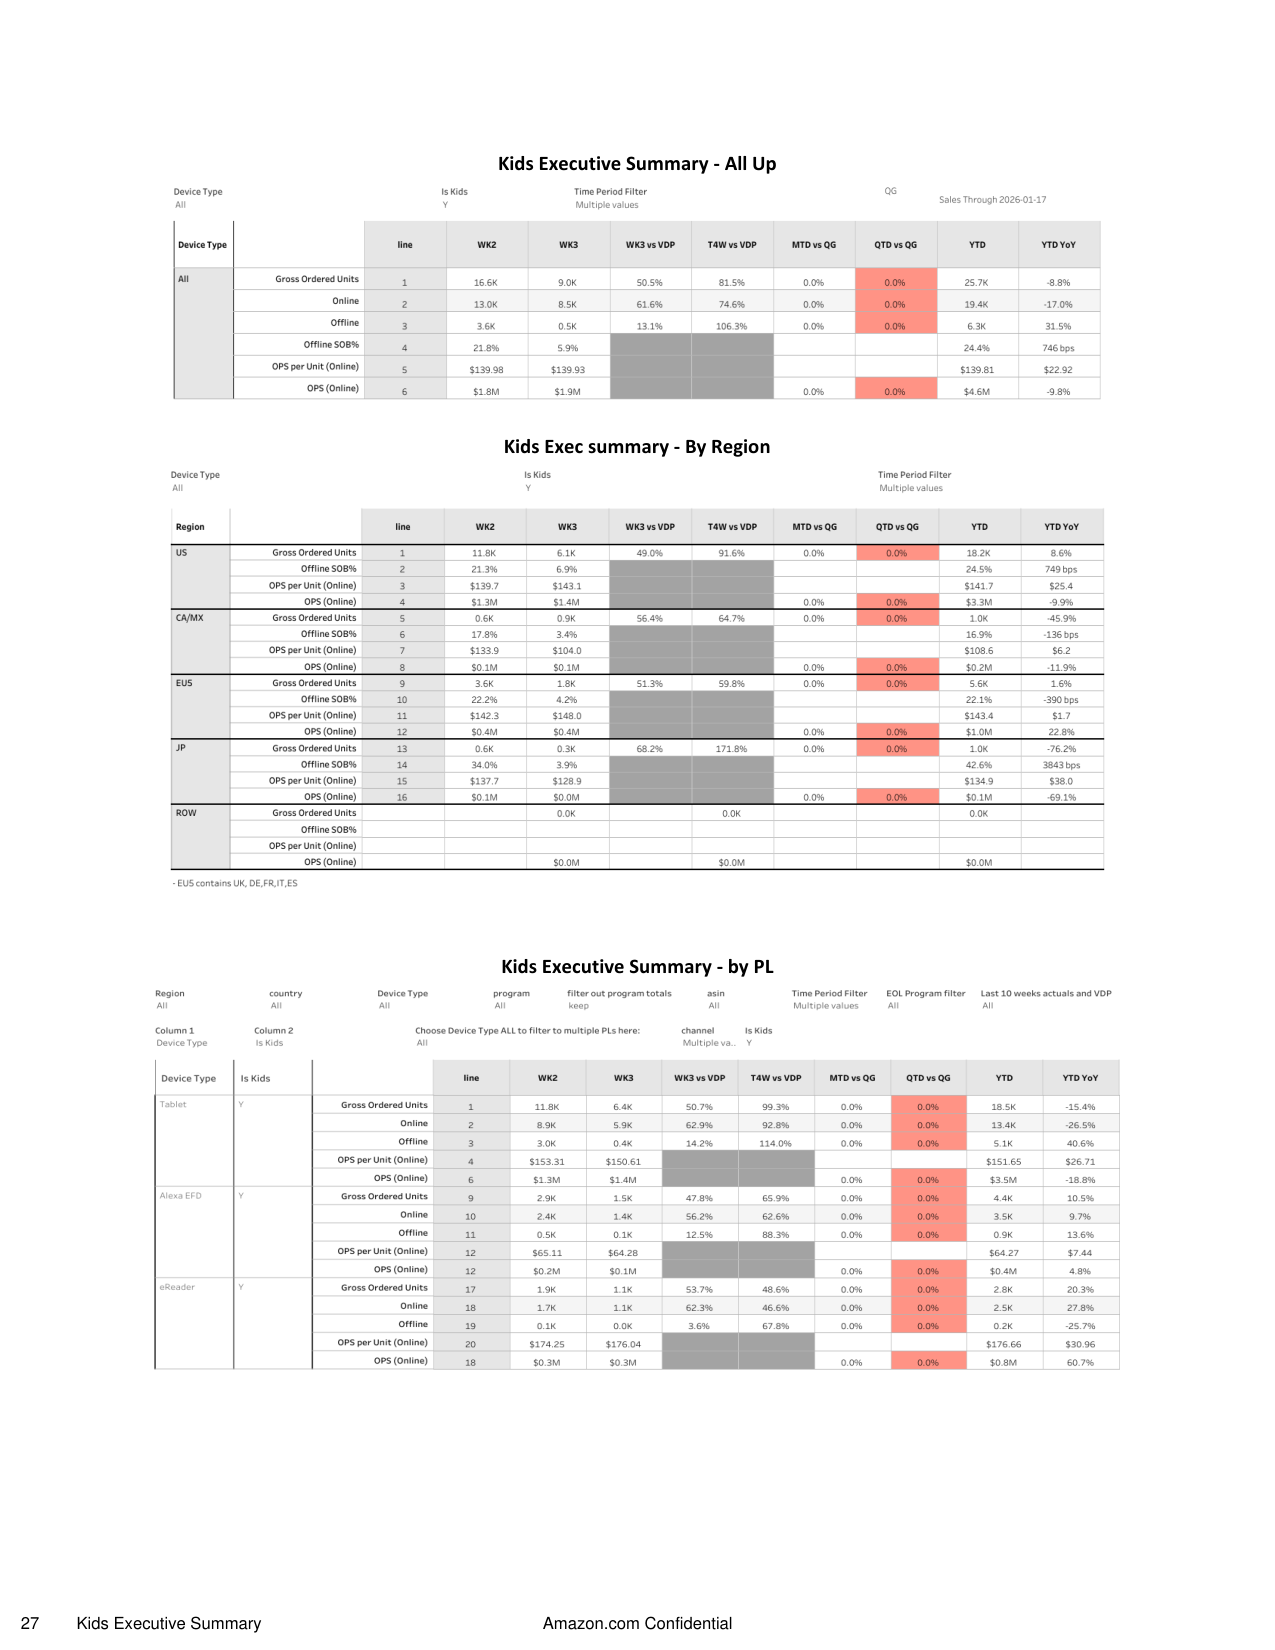
26.
Kids Executive Summary
27.
Sales Back Orders
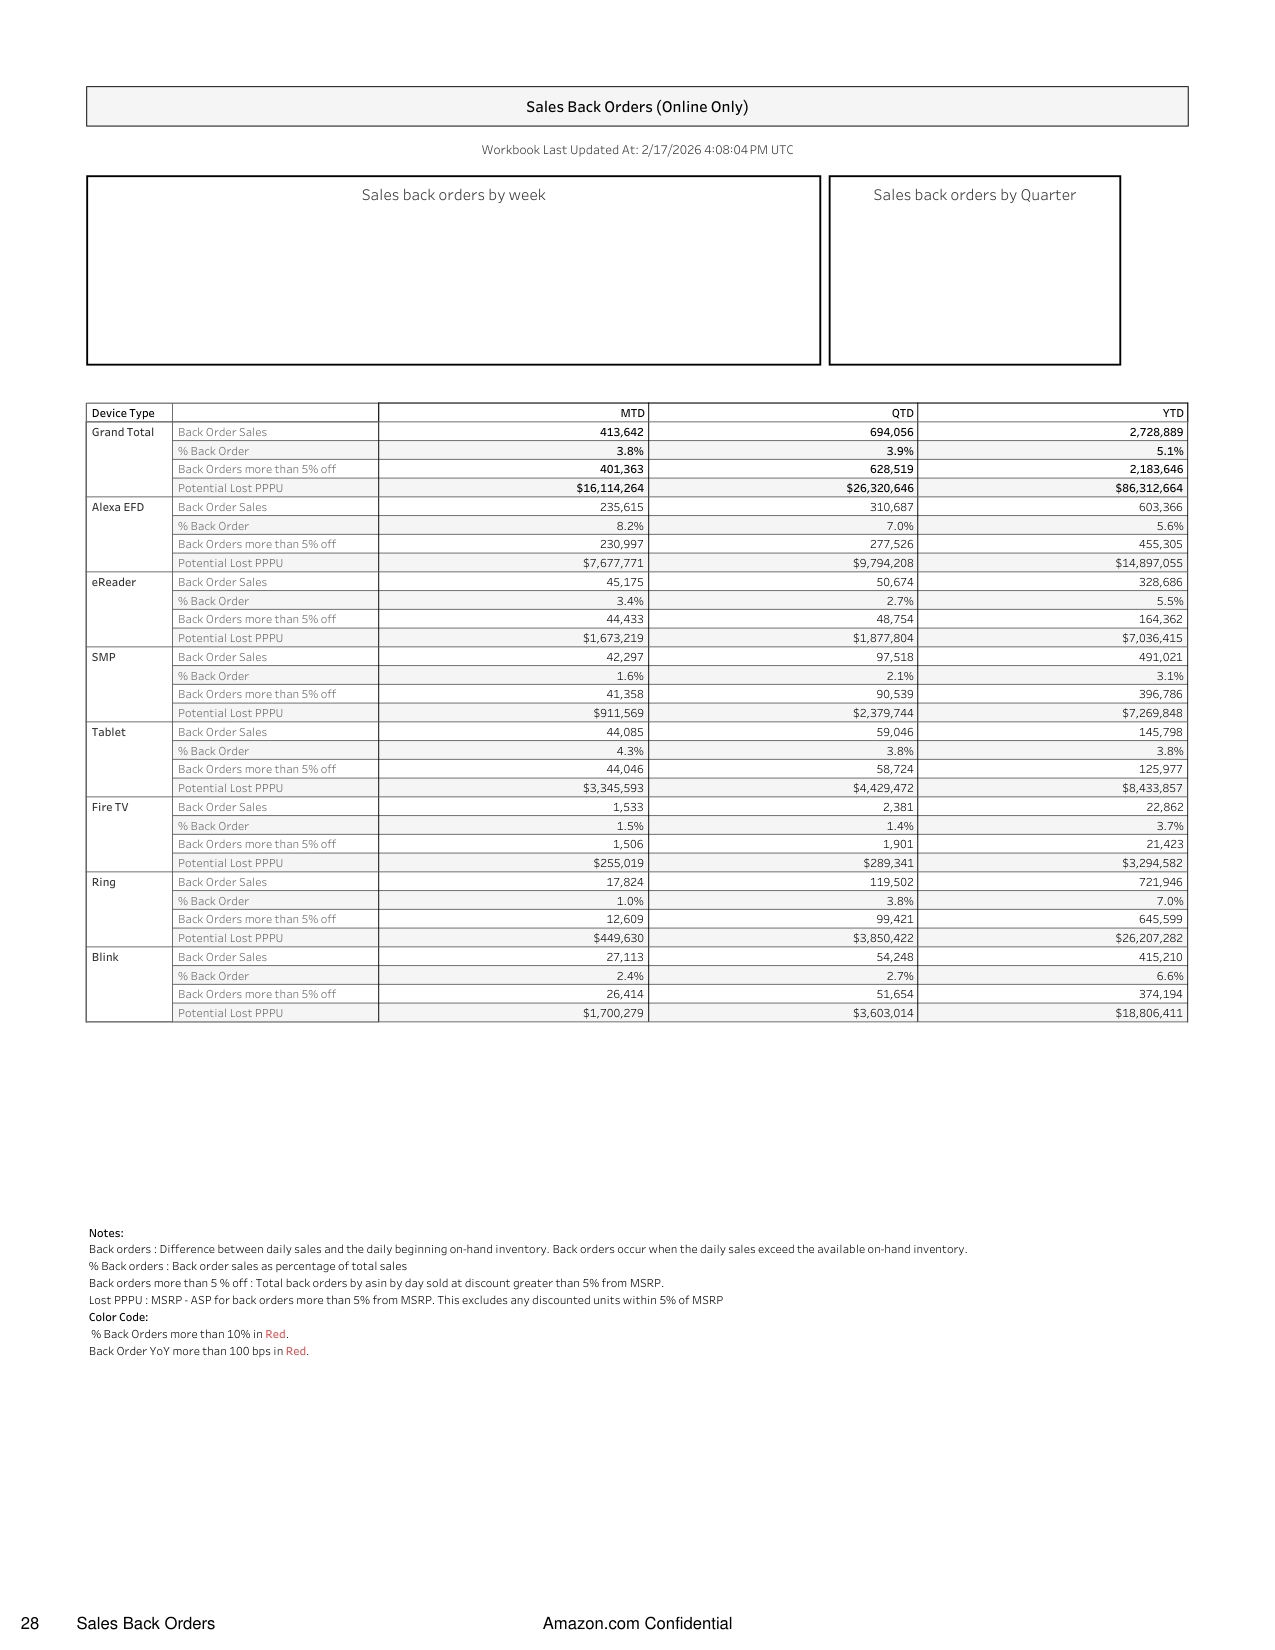
28.
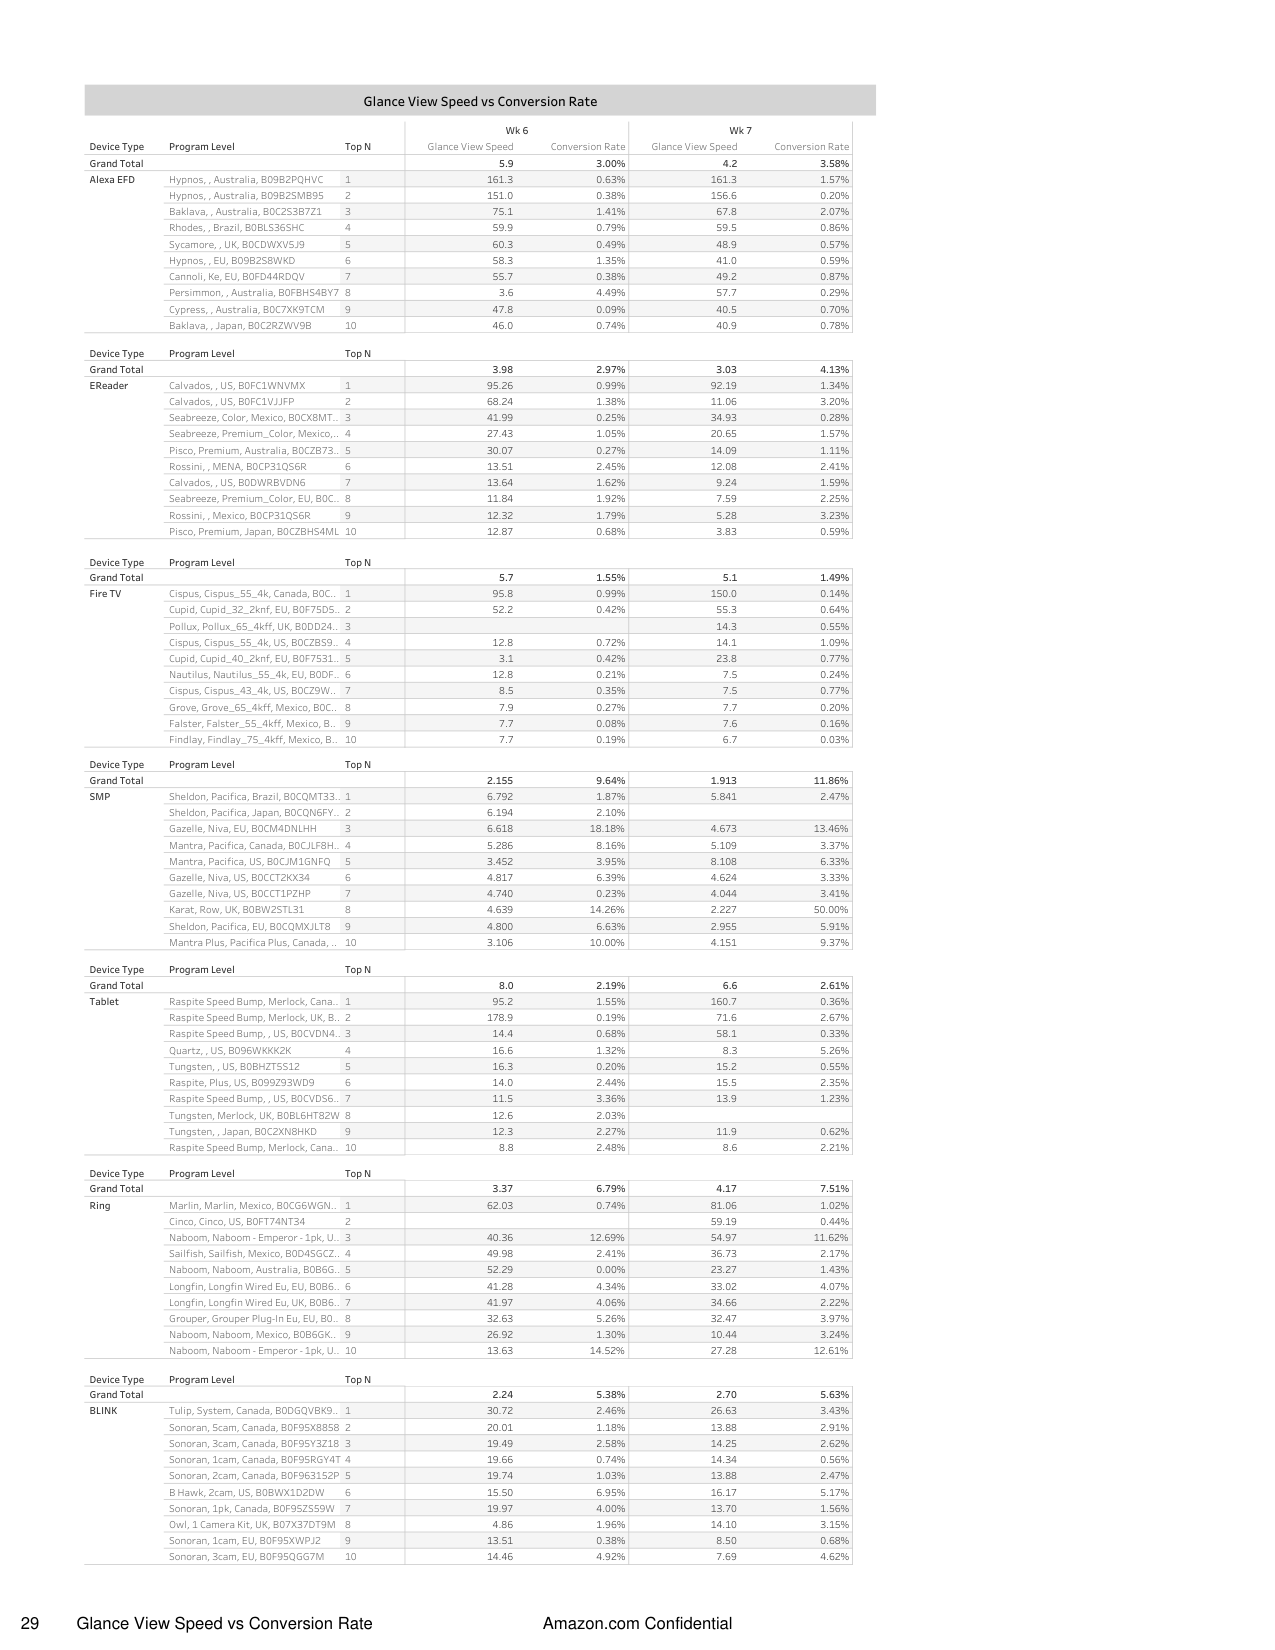
Glance View Speed vs...
29.
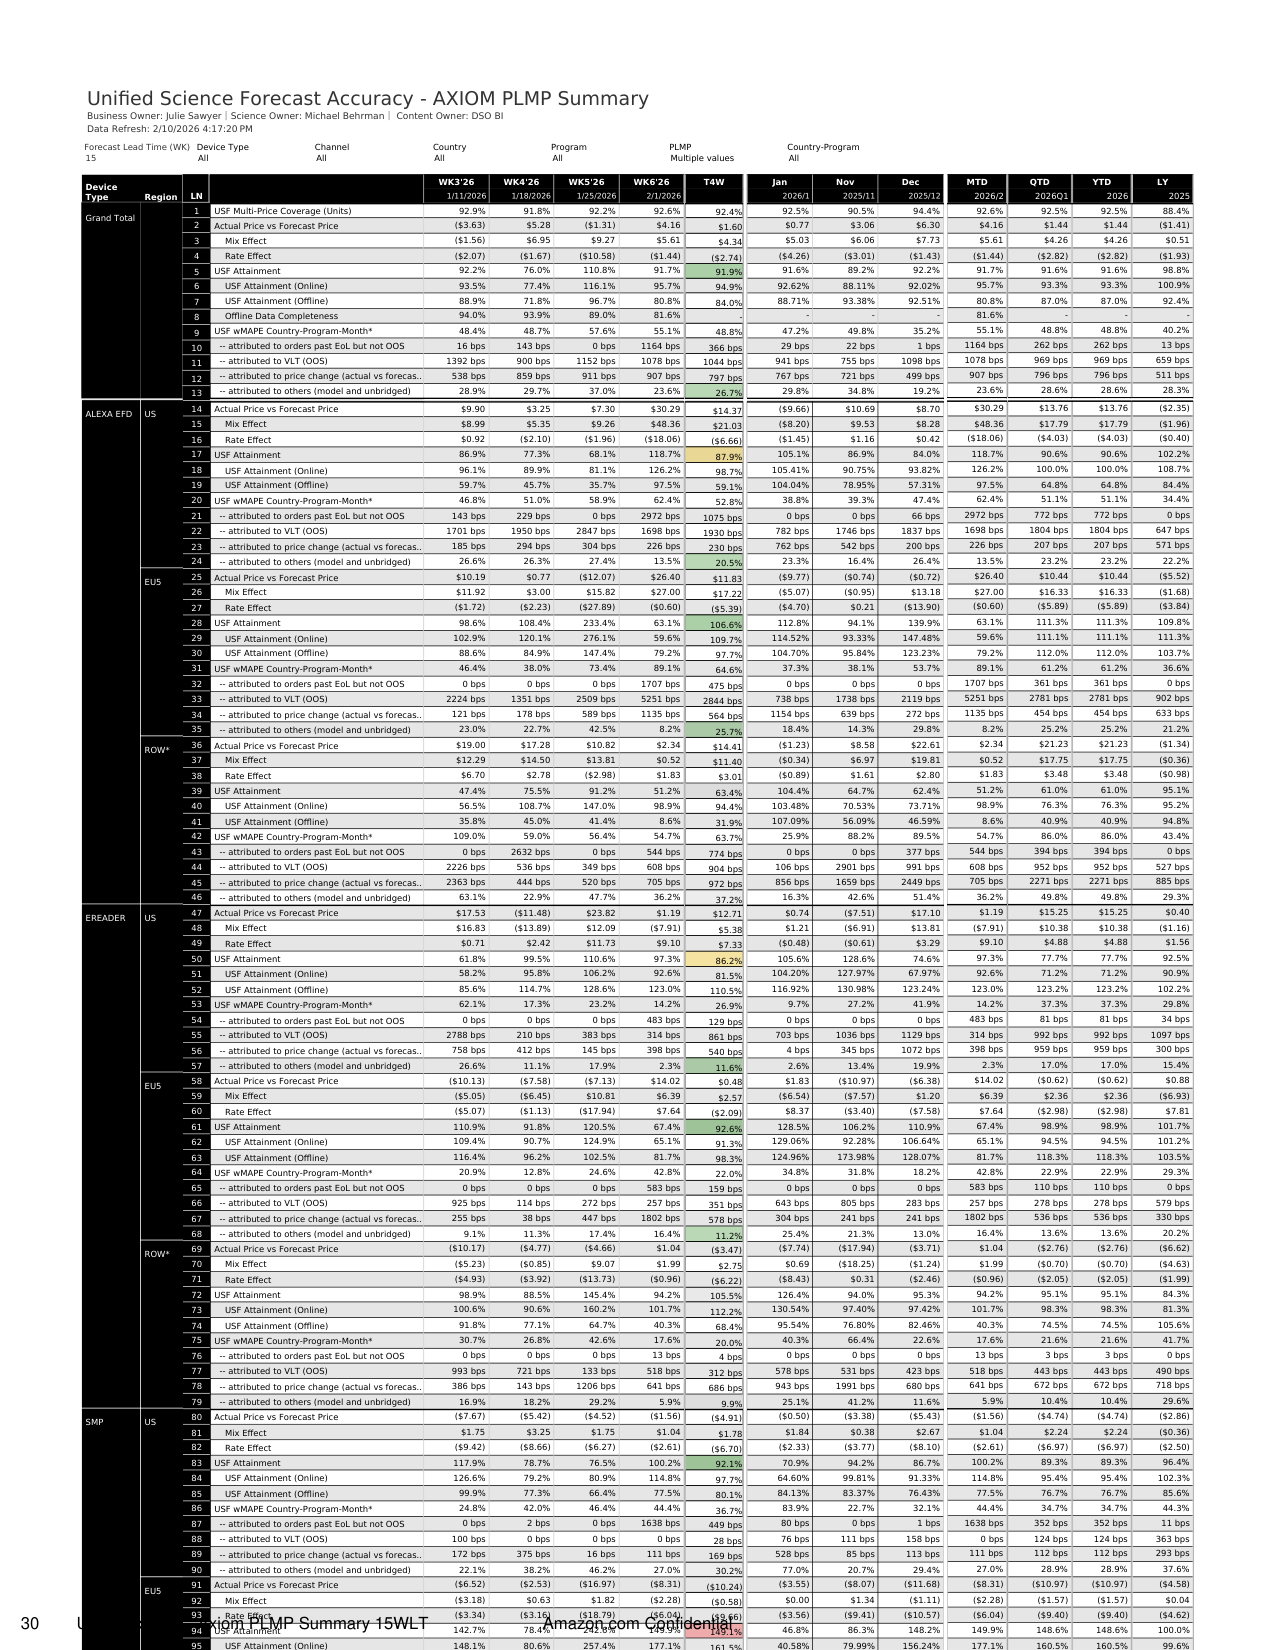
USF Accuracy - Axiom PLMP...
30.
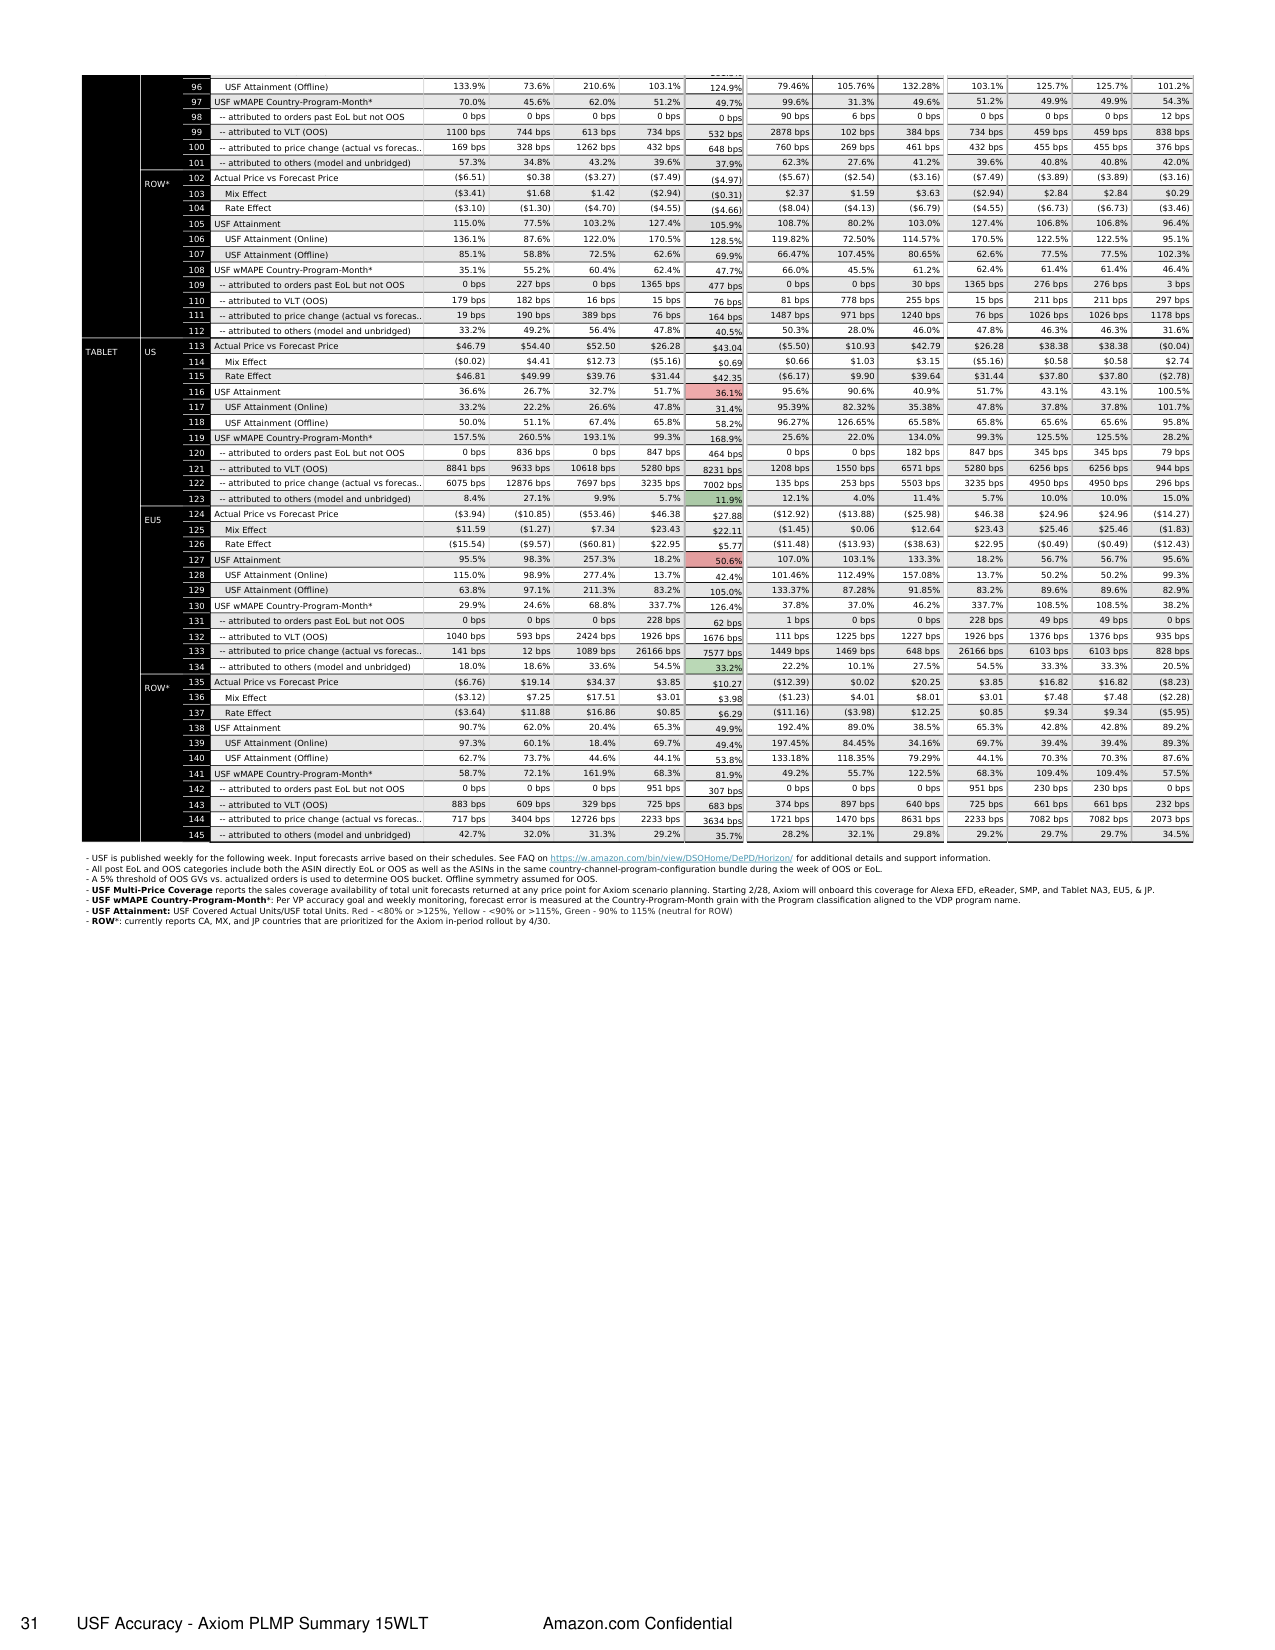
USF Accuracy - Axiom PLMP...
31.
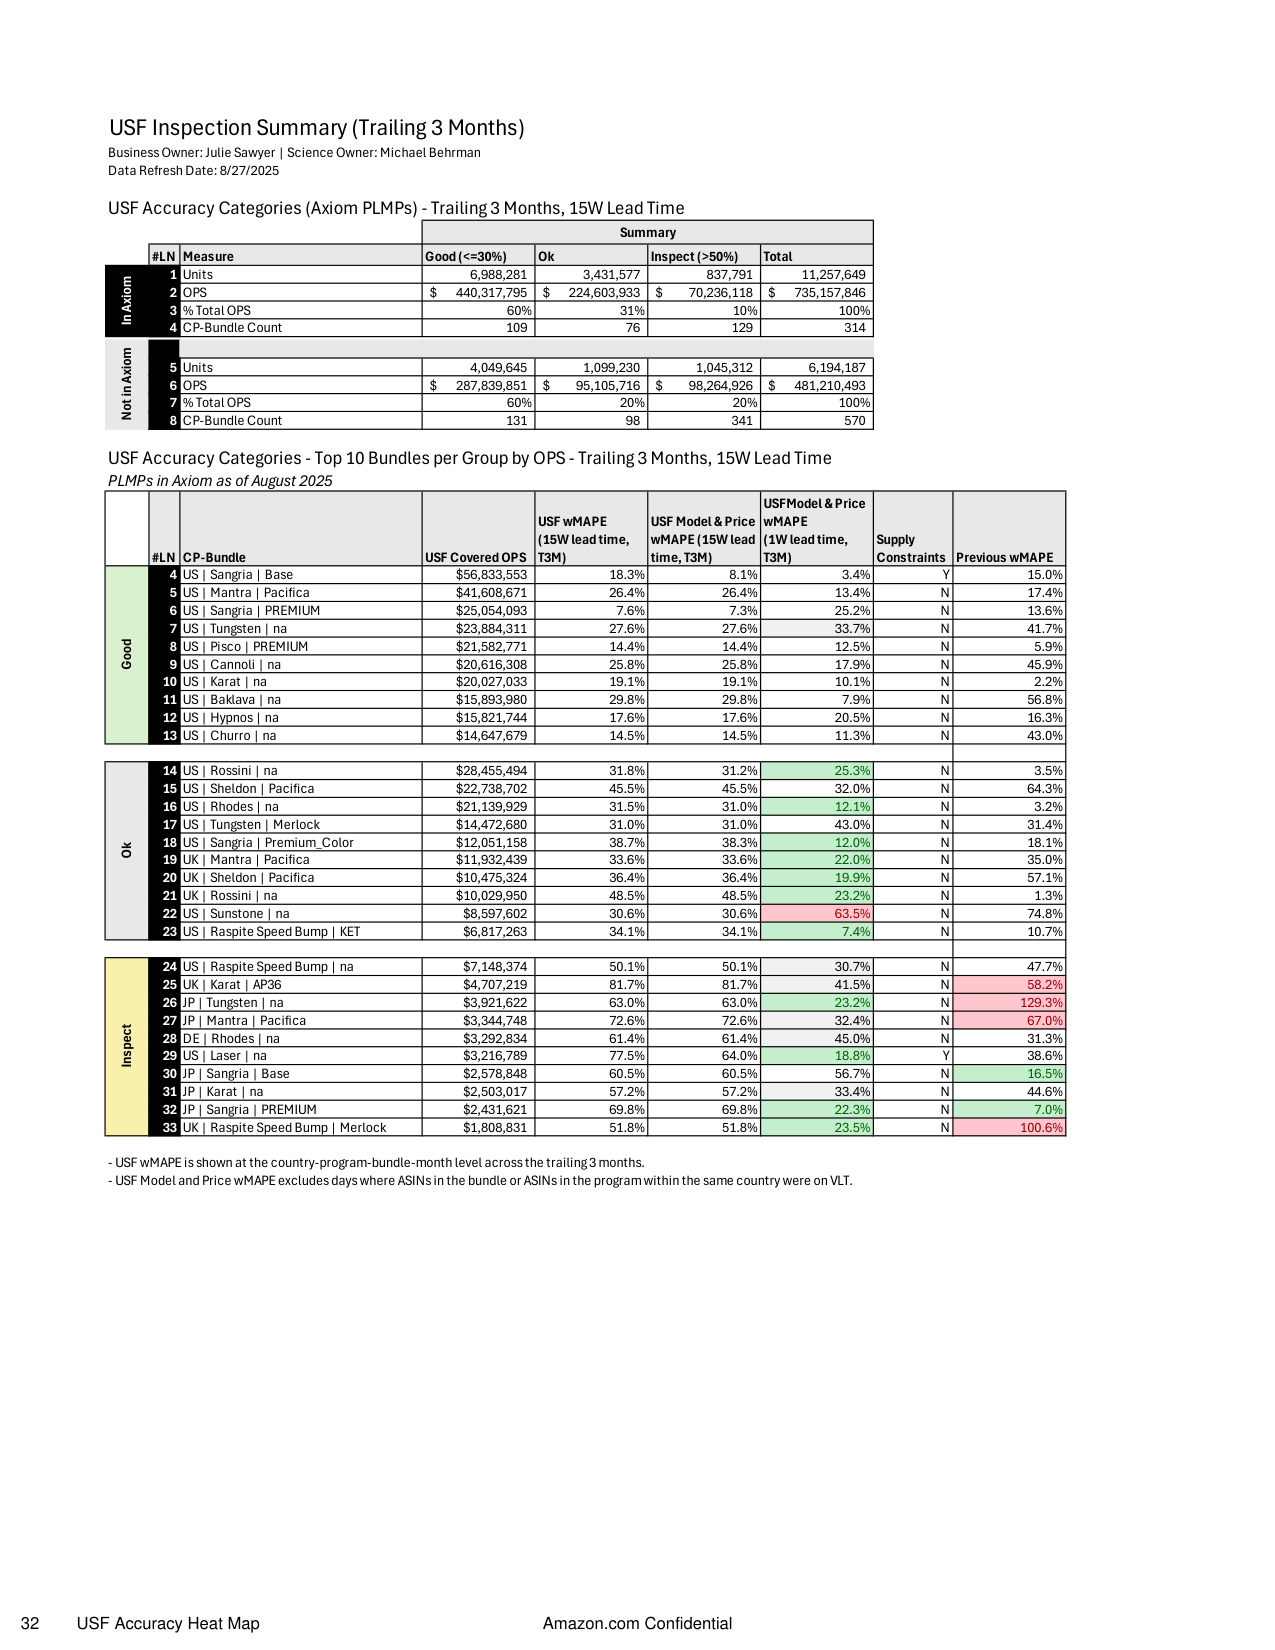
USF Accuracy Heat Map
32.
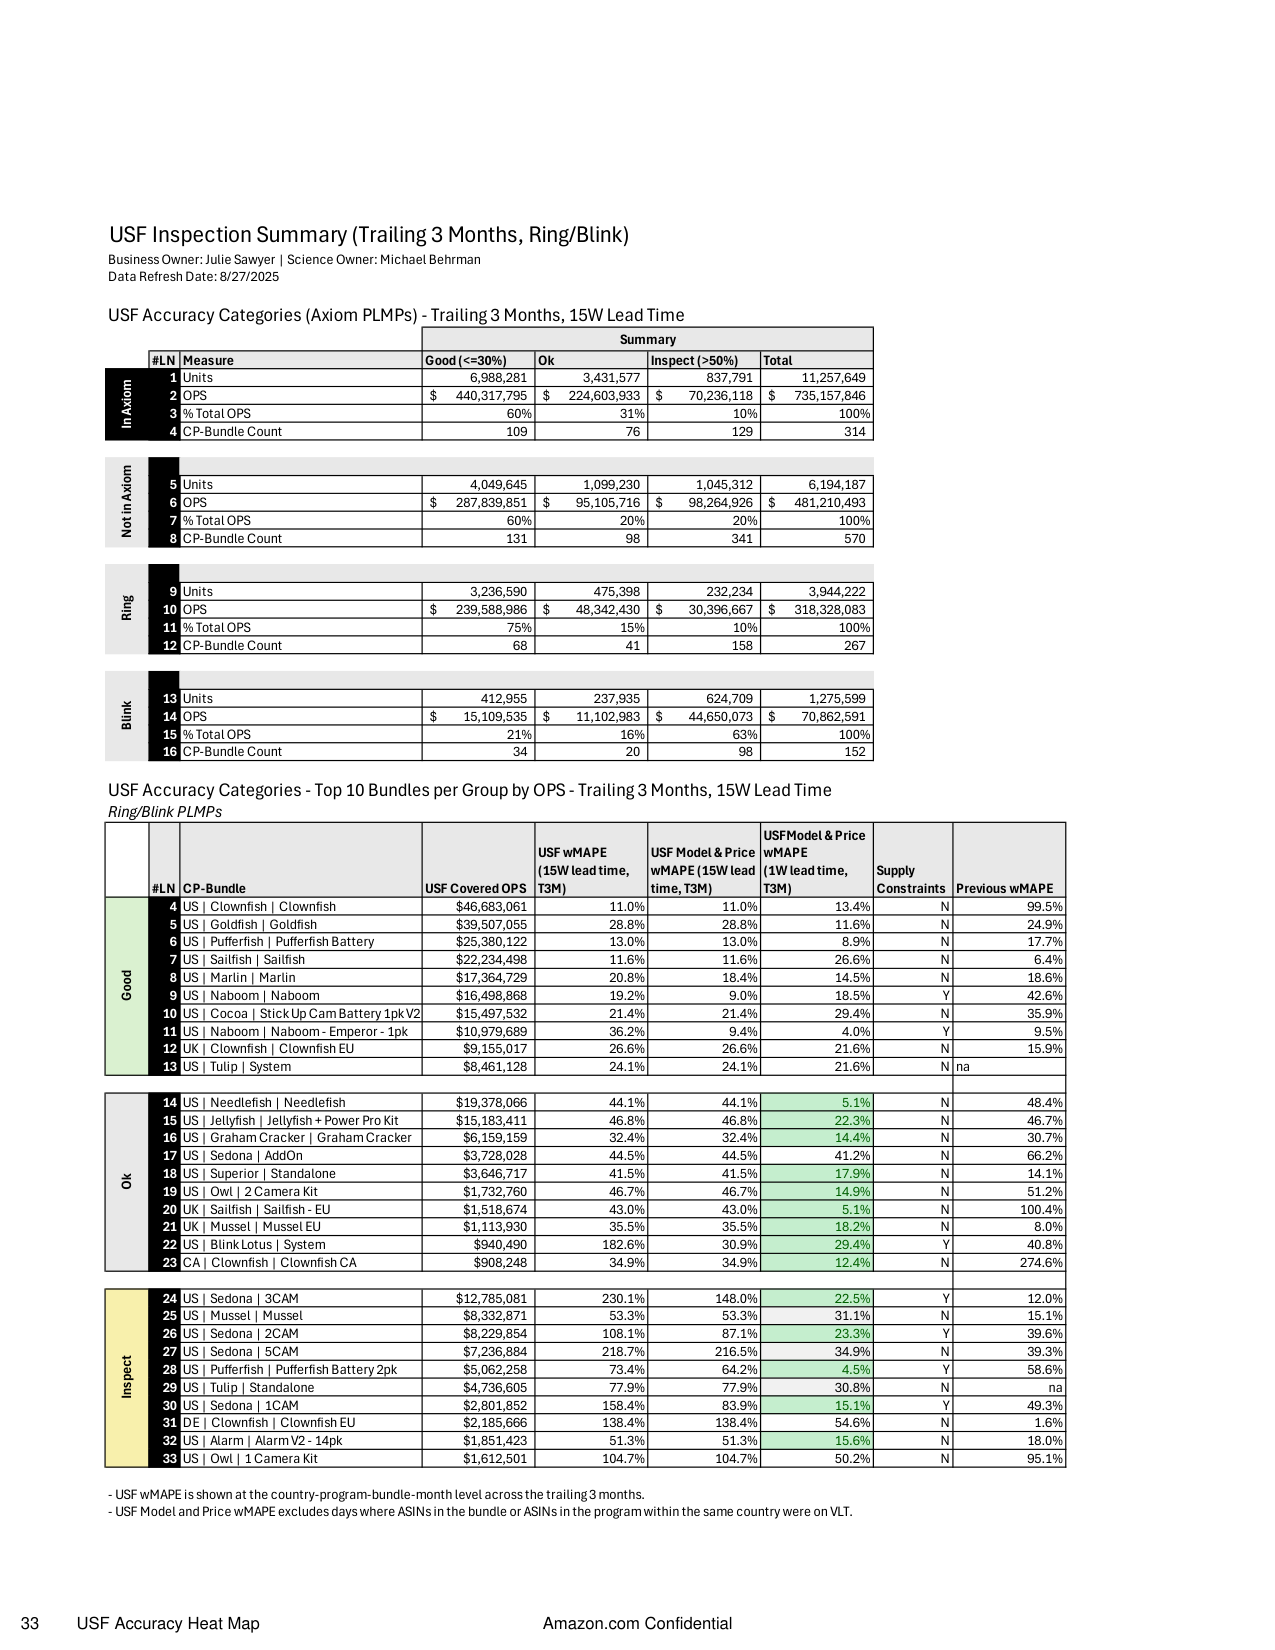
USF Accuracy Heat Map - Ring/Blink
33.
Executive Summary
34.
Executive Summary - Continued
35.
Slide 35